Maltese vs Immigrants from Africa Child Poverty Under the Age of 16
COMPARE
Maltese
Immigrants from Africa
Child Poverty Under the Age of 16
Child Poverty Under the Age of 16 Comparison
Maltese
Immigrants from Africa
13.1%
CHILD POVERTY UNDER THE AGE OF 16
99.8/ 100
METRIC RATING
22nd/ 347
METRIC RANK
18.0%
CHILD POVERTY UNDER THE AGE OF 16
2.5/ 100
METRIC RATING
227th/ 347
METRIC RANK
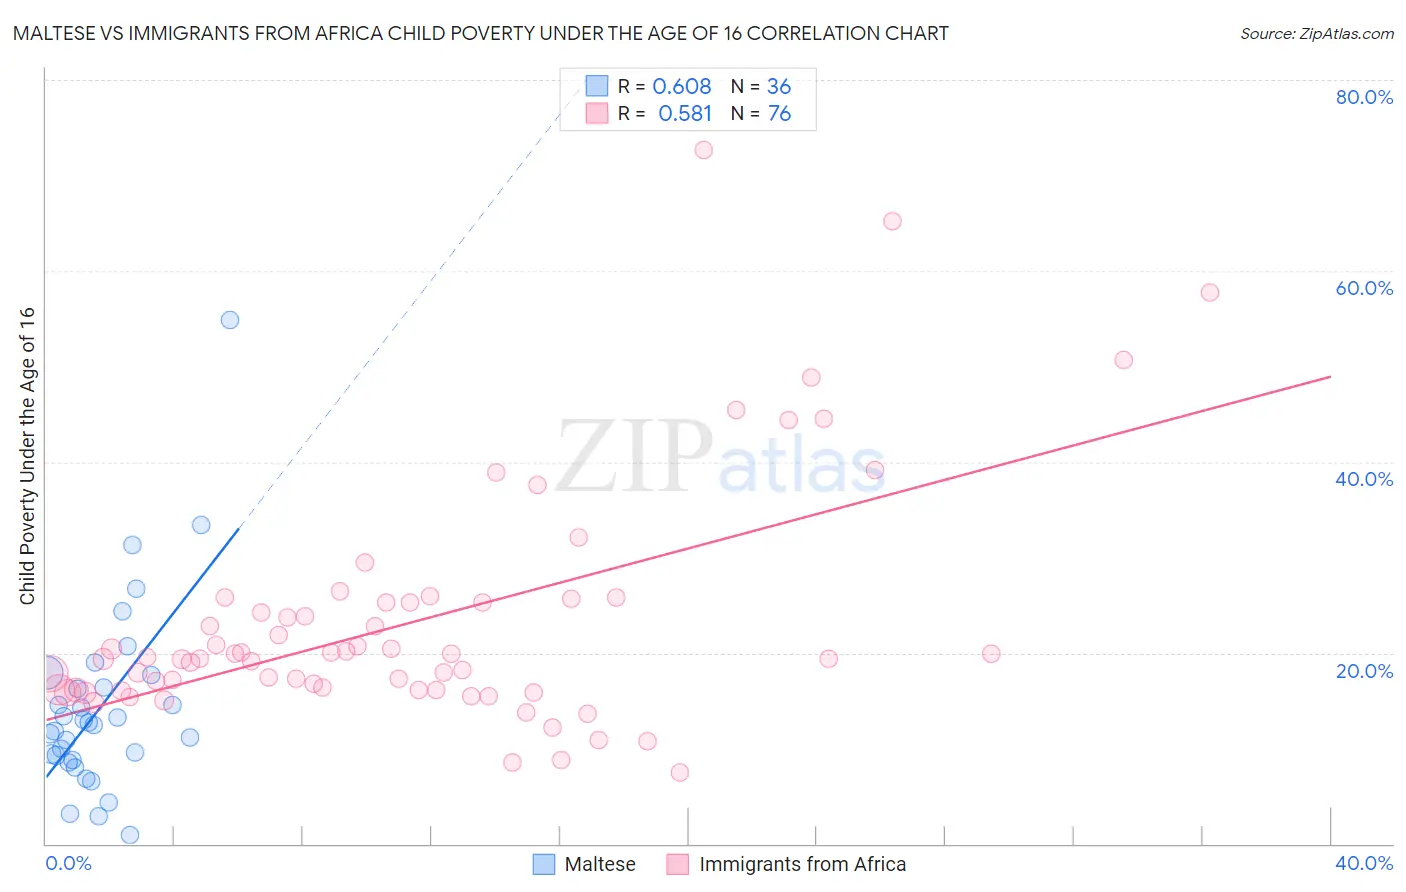
Maltese vs Immigrants from Africa Child Poverty Under the Age of 16 Correlation Chart
The statistical analysis conducted on geographies consisting of 125,710,734 people shows a significant positive correlation between the proportion of Maltese and poverty level among children under the age of 16 in the United States with a correlation coefficient (R) of 0.608 and weighted average of 13.1%. Similarly, the statistical analysis conducted on geographies consisting of 464,107,258 people shows a substantial positive correlation between the proportion of Immigrants from Africa and poverty level among children under the age of 16 in the United States with a correlation coefficient (R) of 0.581 and weighted average of 18.0%, a difference of 36.9%.
Child Poverty Under the Age of 16 Correlation Summary
| Measurement | Maltese | Immigrants from Africa |
| Minimum | 0.98% | 7.4% |
| Maximum | 54.9% | 72.6% |
| Range | 53.9% | 65.2% |
| Mean | 14.4% | 23.3% |
| Median | 12.6% | 19.5% |
| Interquartile 25% (IQ1) | 9.0% | 16.1% |
| Interquartile 75% (IQ3) | 17.0% | 25.3% |
| Interquartile Range (IQR) | 8.0% | 9.1% |
| Standard Deviation (Sample) | 10.1% | 12.5% |
| Standard Deviation (Population) | 9.9% | 12.4% |
Similar Demographics by Child Poverty Under the Age of 16
Demographics Similar to Maltese by Child Poverty Under the Age of 16
In terms of child poverty under the age of 16, the demographic groups most similar to Maltese are Indian (Asian) (13.1%, a difference of 0.040%), Immigrants from Eastern Asia (13.1%, a difference of 0.080%), Okinawan (13.1%, a difference of 0.11%), Latvian (13.2%, a difference of 0.25%), and Eastern European (13.2%, a difference of 0.33%).
| Demographics | Rating | Rank | Child Poverty Under the Age of 16 |
| Immigrants | Korea | 99.9 /100 | #15 | Exceptional 13.0% |
| Norwegians | 99.9 /100 | #16 | Exceptional 13.0% |
| Bulgarians | 99.9 /100 | #17 | Exceptional 13.0% |
| Cypriots | 99.9 /100 | #18 | Exceptional 13.0% |
| Immigrants | Japan | 99.8 /100 | #19 | Exceptional 13.0% |
| Okinawans | 99.8 /100 | #20 | Exceptional 13.1% |
| Immigrants | Eastern Asia | 99.8 /100 | #21 | Exceptional 13.1% |
| Maltese | 99.8 /100 | #22 | Exceptional 13.1% |
| Indians (Asian) | 99.8 /100 | #23 | Exceptional 13.1% |
| Latvians | 99.8 /100 | #24 | Exceptional 13.2% |
| Eastern Europeans | 99.8 /100 | #25 | Exceptional 13.2% |
| Bolivians | 99.8 /100 | #26 | Exceptional 13.2% |
| Immigrants | China | 99.8 /100 | #27 | Exceptional 13.3% |
| Assyrians/Chaldeans/Syriacs | 99.7 /100 | #28 | Exceptional 13.3% |
| Swedes | 99.7 /100 | #29 | Exceptional 13.3% |
Demographics Similar to Immigrants from Africa by Child Poverty Under the Age of 16
In terms of child poverty under the age of 16, the demographic groups most similar to Immigrants from Africa are Immigrants from Micronesia (18.0%, a difference of 0.15%), Bermudan (18.0%, a difference of 0.18%), Nonimmigrants (17.9%, a difference of 0.25%), Osage (17.9%, a difference of 0.62%), and Immigrants from Cambodia (17.8%, a difference of 0.85%).
| Demographics | Rating | Rank | Child Poverty Under the Age of 16 |
| Immigrants | Panama | 4.1 /100 | #220 | Tragic 17.7% |
| Cubans | 3.7 /100 | #221 | Tragic 17.8% |
| Immigrants | Armenia | 3.6 /100 | #222 | Tragic 17.8% |
| Immigrants | Cambodia | 3.3 /100 | #223 | Tragic 17.8% |
| Osage | 3.1 /100 | #224 | Tragic 17.9% |
| Immigrants | Nonimmigrants | 2.7 /100 | #225 | Tragic 17.9% |
| Bermudans | 2.6 /100 | #226 | Tragic 18.0% |
| Immigrants | Africa | 2.5 /100 | #227 | Tragic 18.0% |
| Immigrants | Micronesia | 2.3 /100 | #228 | Tragic 18.0% |
| Marshallese | 1.8 /100 | #229 | Tragic 18.1% |
| Nepalese | 1.7 /100 | #230 | Tragic 18.2% |
| Nicaraguans | 1.7 /100 | #231 | Tragic 18.2% |
| Americans | 1.2 /100 | #232 | Tragic 18.3% |
| Fijians | 1.1 /100 | #233 | Tragic 18.4% |
| Immigrants | Nigeria | 1.0 /100 | #234 | Tragic 18.4% |