Maltese vs Hopi Single Father Poverty
COMPARE
Maltese
Hopi
Single Father Poverty
Single Father Poverty Comparison
Maltese
Hopi
15.3%
SINGLE FATHER POVERTY
99.6/ 100
METRIC RATING
74th/ 347
METRIC RANK
27.2%
SINGLE FATHER POVERTY
0.0/ 100
METRIC RATING
341st/ 347
METRIC RANK
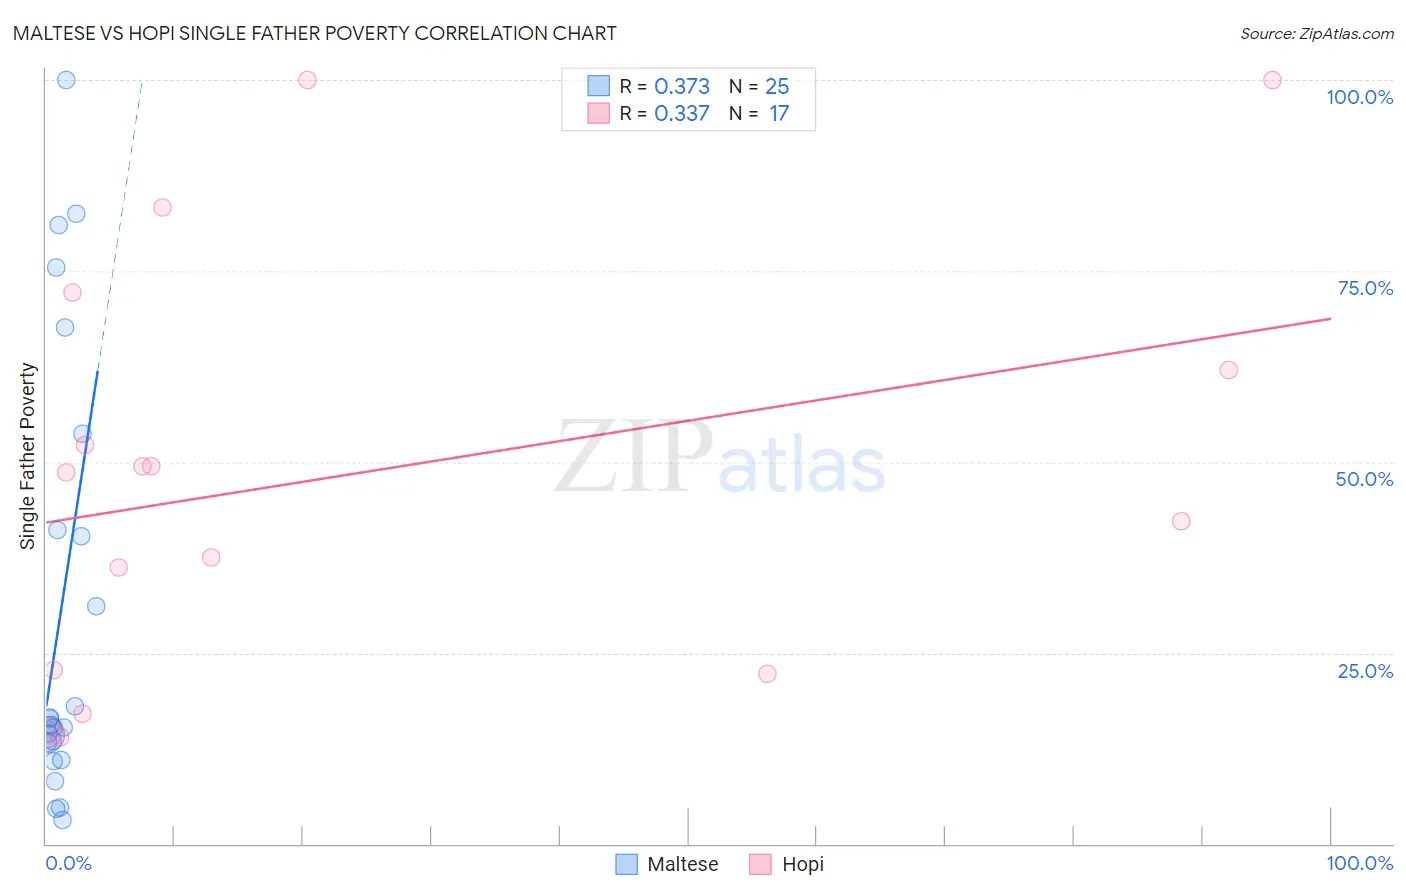
Maltese vs Hopi Single Father Poverty Correlation Chart
The statistical analysis conducted on geographies consisting of 108,726,955 people shows a mild positive correlation between the proportion of Maltese and poverty level among single fathers in the United States with a correlation coefficient (R) of 0.373 and weighted average of 15.3%. Similarly, the statistical analysis conducted on geographies consisting of 69,635,854 people shows a mild positive correlation between the proportion of Hopi and poverty level among single fathers in the United States with a correlation coefficient (R) of 0.337 and weighted average of 27.2%, a difference of 77.3%.
Single Father Poverty Correlation Summary
| Measurement | Maltese | Hopi |
| Minimum | 3.0% | 14.0% |
| Maximum | 100.0% | 100.0% |
| Range | 97.0% | 86.0% |
| Mean | 30.7% | 48.4% |
| Median | 15.5% | 48.6% |
| Interquartile 25% (IQ1) | 12.2% | 22.5% |
| Interquartile 75% (IQ3) | 47.4% | 67.1% |
| Interquartile Range (IQR) | 35.3% | 44.7% |
| Standard Deviation (Sample) | 28.8% | 27.7% |
| Standard Deviation (Population) | 28.2% | 26.9% |
Similar Demographics by Single Father Poverty
Demographics Similar to Maltese by Single Father Poverty
In terms of single father poverty, the demographic groups most similar to Maltese are Immigrants from Turkey (15.3%, a difference of 0.020%), Kenyan (15.3%, a difference of 0.040%), Immigrants from Japan (15.3%, a difference of 0.10%), Immigrants from Peru (15.3%, a difference of 0.11%), and Immigrants from Lithuania (15.3%, a difference of 0.13%).
| Demographics | Rating | Rank | Single Father Poverty |
| Paraguayans | 99.7 /100 | #67 | Exceptional 15.2% |
| Immigrants | Cameroon | 99.7 /100 | #68 | Exceptional 15.2% |
| Japanese | 99.7 /100 | #69 | Exceptional 15.2% |
| Mongolians | 99.7 /100 | #70 | Exceptional 15.3% |
| Immigrants | Brazil | 99.6 /100 | #71 | Exceptional 15.3% |
| Immigrants | Lithuania | 99.6 /100 | #72 | Exceptional 15.3% |
| Kenyans | 99.6 /100 | #73 | Exceptional 15.3% |
| Maltese | 99.6 /100 | #74 | Exceptional 15.3% |
| Immigrants | Turkey | 99.5 /100 | #75 | Exceptional 15.3% |
| Immigrants | Japan | 99.5 /100 | #76 | Exceptional 15.3% |
| Immigrants | Peru | 99.5 /100 | #77 | Exceptional 15.3% |
| Tlingit-Haida | 99.5 /100 | #78 | Exceptional 15.3% |
| Immigrants | Northern Africa | 99.5 /100 | #79 | Exceptional 15.3% |
| Armenians | 99.4 /100 | #80 | Exceptional 15.4% |
| Immigrants | Congo | 99.4 /100 | #81 | Exceptional 15.4% |
Demographics Similar to Hopi by Single Father Poverty
In terms of single father poverty, the demographic groups most similar to Hopi are Houma (26.7%, a difference of 1.6%), Yuman (28.4%, a difference of 4.5%), Lumbee (28.5%, a difference of 4.9%), Navajo (29.2%, a difference of 7.6%), and Crow (30.3%, a difference of 11.5%).
| Demographics | Rating | Rank | Single Father Poverty |
| Natives/Alaskans | 0.0 /100 | #333 | Tragic 22.4% |
| Kiowa | 0.0 /100 | #334 | Tragic 22.5% |
| Shoshone | 0.0 /100 | #335 | Tragic 22.9% |
| Cajuns | 0.0 /100 | #336 | Tragic 23.1% |
| Sioux | 0.0 /100 | #337 | Tragic 23.9% |
| Arapaho | 0.0 /100 | #338 | Tragic 24.0% |
| Apache | 0.0 /100 | #339 | Tragic 24.2% |
| Houma | 0.0 /100 | #340 | Tragic 26.7% |
| Hopi | 0.0 /100 | #341 | Tragic 27.2% |
| Yuman | 0.0 /100 | #342 | Tragic 28.4% |
| Lumbee | 0.0 /100 | #343 | Tragic 28.5% |
| Navajo | 0.0 /100 | #344 | Tragic 29.2% |
| Crow | 0.0 /100 | #345 | Tragic 30.3% |
| Puerto Ricans | 0.0 /100 | #346 | Tragic 31.5% |
| Yup'ik | 0.0 /100 | #347 | Tragic 32.5% |