Immigrants from Russia vs Choctaw Seniors Poverty Over the Age of 75
COMPARE
Immigrants from Russia
Choctaw
Seniors Poverty Over the Age of 75
Seniors Poverty Over the Age of 75 Comparison
Immigrants from Russia
Choctaw
13.4%
SENIORS POVERTY OVER THE AGE OF 75
0.6/ 100
METRIC RATING
241st/ 347
METRIC RANK
12.5%
SENIORS POVERTY OVER THE AGE OF 75
20.2/ 100
METRIC RATING
192nd/ 347
METRIC RANK
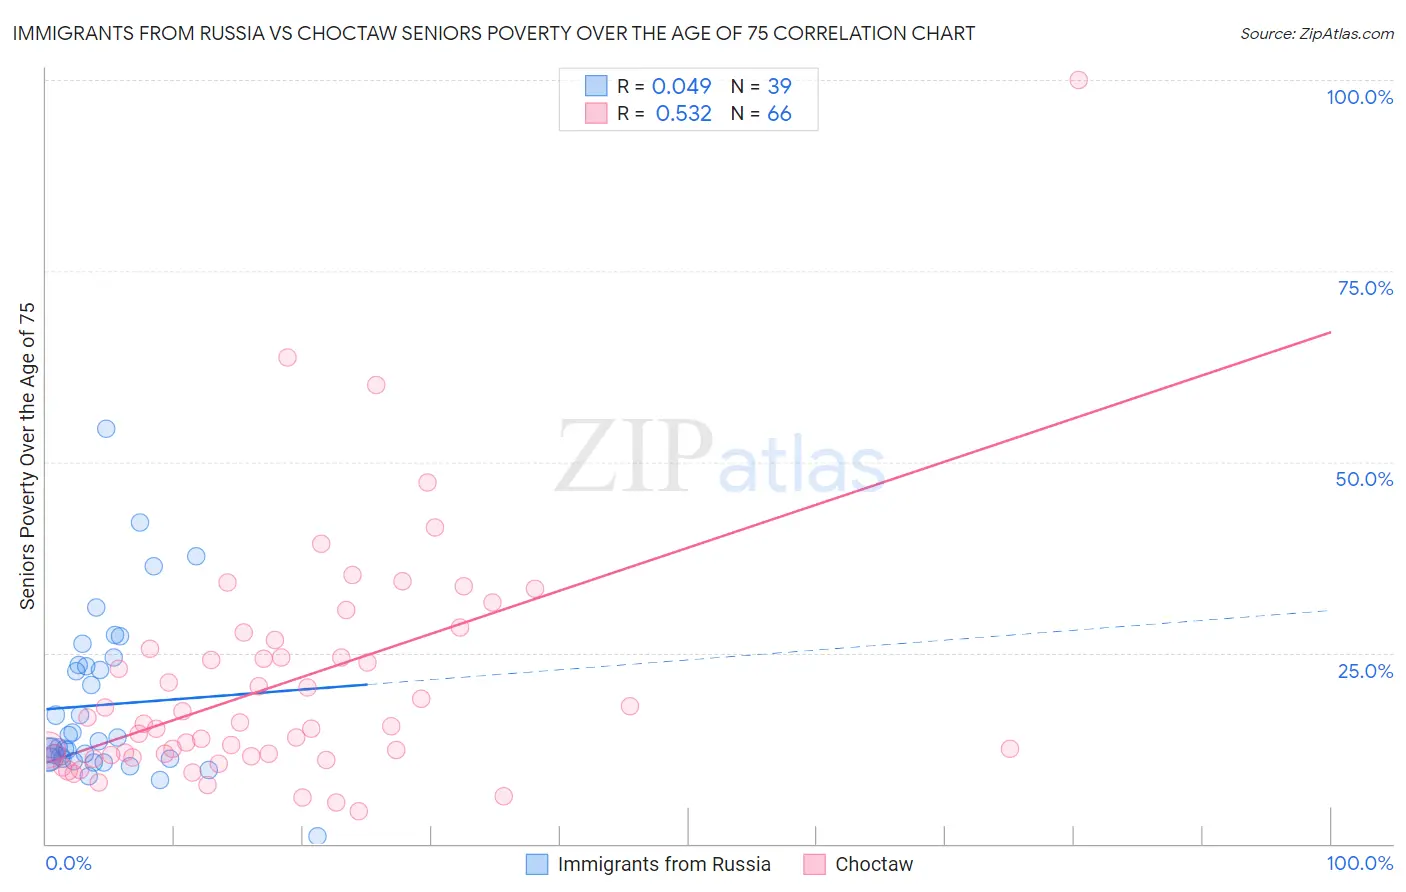
Immigrants from Russia vs Choctaw Seniors Poverty Over the Age of 75 Correlation Chart
The statistical analysis conducted on geographies consisting of 344,073,236 people shows no correlation between the proportion of Immigrants from Russia and poverty level among seniors over the age of 75 in the United States with a correlation coefficient (R) of 0.049 and weighted average of 13.4%. Similarly, the statistical analysis conducted on geographies consisting of 267,399,260 people shows a substantial positive correlation between the proportion of Choctaw and poverty level among seniors over the age of 75 in the United States with a correlation coefficient (R) of 0.532 and weighted average of 12.5%, a difference of 7.3%.
Seniors Poverty Over the Age of 75 Correlation Summary
| Measurement | Immigrants from Russia | Choctaw |
| Minimum | 1.1% | 4.2% |
| Maximum | 54.4% | 100.0% |
| Range | 53.3% | 95.8% |
| Mean | 18.2% | 20.9% |
| Median | 13.4% | 15.6% |
| Interquartile 25% (IQ1) | 11.1% | 11.6% |
| Interquartile 75% (IQ3) | 23.4% | 25.5% |
| Interquartile Range (IQR) | 12.4% | 13.9% |
| Standard Deviation (Sample) | 10.8% | 15.7% |
| Standard Deviation (Population) | 10.7% | 15.6% |
Similar Demographics by Seniors Poverty Over the Age of 75
Demographics Similar to Immigrants from Russia by Seniors Poverty Over the Age of 75
In terms of seniors poverty over the age of 75, the demographic groups most similar to Immigrants from Russia are Immigrants from Somalia (13.5%, a difference of 0.10%), Dutch West Indian (13.5%, a difference of 0.12%), Argentinean (13.4%, a difference of 0.14%), Spanish American (13.5%, a difference of 0.44%), and Panamanian (13.4%, a difference of 0.45%).
| Demographics | Rating | Rank | Seniors Poverty Over the Age of 75 |
| Immigrants | Israel | 1.1 /100 | #234 | Tragic 13.3% |
| Japanese | 0.9 /100 | #235 | Tragic 13.3% |
| Moroccans | 0.9 /100 | #236 | Tragic 13.3% |
| Alaskan Athabascans | 0.8 /100 | #237 | Tragic 13.4% |
| Peruvians | 0.8 /100 | #238 | Tragic 13.4% |
| Panamanians | 0.8 /100 | #239 | Tragic 13.4% |
| Argentineans | 0.7 /100 | #240 | Tragic 13.4% |
| Immigrants | Russia | 0.6 /100 | #241 | Tragic 13.4% |
| Immigrants | Somalia | 0.6 /100 | #242 | Tragic 13.5% |
| Dutch West Indians | 0.6 /100 | #243 | Tragic 13.5% |
| Spanish Americans | 0.5 /100 | #244 | Tragic 13.5% |
| Uruguayans | 0.5 /100 | #245 | Tragic 13.5% |
| Immigrants | Cambodia | 0.4 /100 | #246 | Tragic 13.6% |
| Immigrants | Ukraine | 0.3 /100 | #247 | Tragic 13.6% |
| Africans | 0.3 /100 | #248 | Tragic 13.6% |
Demographics Similar to Choctaw by Seniors Poverty Over the Age of 75
In terms of seniors poverty over the age of 75, the demographic groups most similar to Choctaw are Taiwanese (12.6%, a difference of 0.31%), Alsatian (12.6%, a difference of 0.32%), Liberian (12.5%, a difference of 0.35%), Immigrants from France (12.6%, a difference of 0.37%), and Immigrants from Congo (12.5%, a difference of 0.42%).
| Demographics | Rating | Rank | Seniors Poverty Over the Age of 75 |
| Immigrants | Malaysia | 35.8 /100 | #185 | Fair 12.3% |
| Sri Lankans | 32.3 /100 | #186 | Fair 12.4% |
| Yaqui | 25.9 /100 | #187 | Fair 12.5% |
| Immigrants | Northern Africa | 25.2 /100 | #188 | Fair 12.5% |
| Immigrants | Indonesia | 24.4 /100 | #189 | Fair 12.5% |
| Immigrants | Congo | 23.9 /100 | #190 | Fair 12.5% |
| Liberians | 23.2 /100 | #191 | Fair 12.5% |
| Choctaw | 20.2 /100 | #192 | Fair 12.5% |
| Taiwanese | 17.8 /100 | #193 | Poor 12.6% |
| Alsatians | 17.7 /100 | #194 | Poor 12.6% |
| Immigrants | France | 17.4 /100 | #195 | Poor 12.6% |
| Immigrants | Eastern Europe | 16.0 /100 | #196 | Poor 12.6% |
| Nepalese | 14.4 /100 | #197 | Poor 12.6% |
| Chileans | 13.7 /100 | #198 | Poor 12.6% |
| Immigrants | Lebanon | 12.7 /100 | #199 | Poor 12.7% |