Luxembourger vs Northern European Child Poverty Under the Age of 16
COMPARE
Luxembourger
Northern European
Child Poverty Under the Age of 16
Child Poverty Under the Age of 16 Comparison
Luxembourgers
Northern Europeans
13.6%
CHILD POVERTY UNDER THE AGE OF 16
99.5/ 100
METRIC RATING
38th/ 347
METRIC RANK
14.5%
CHILD POVERTY UNDER THE AGE OF 16
97.0/ 100
METRIC RATING
88th/ 347
METRIC RANK
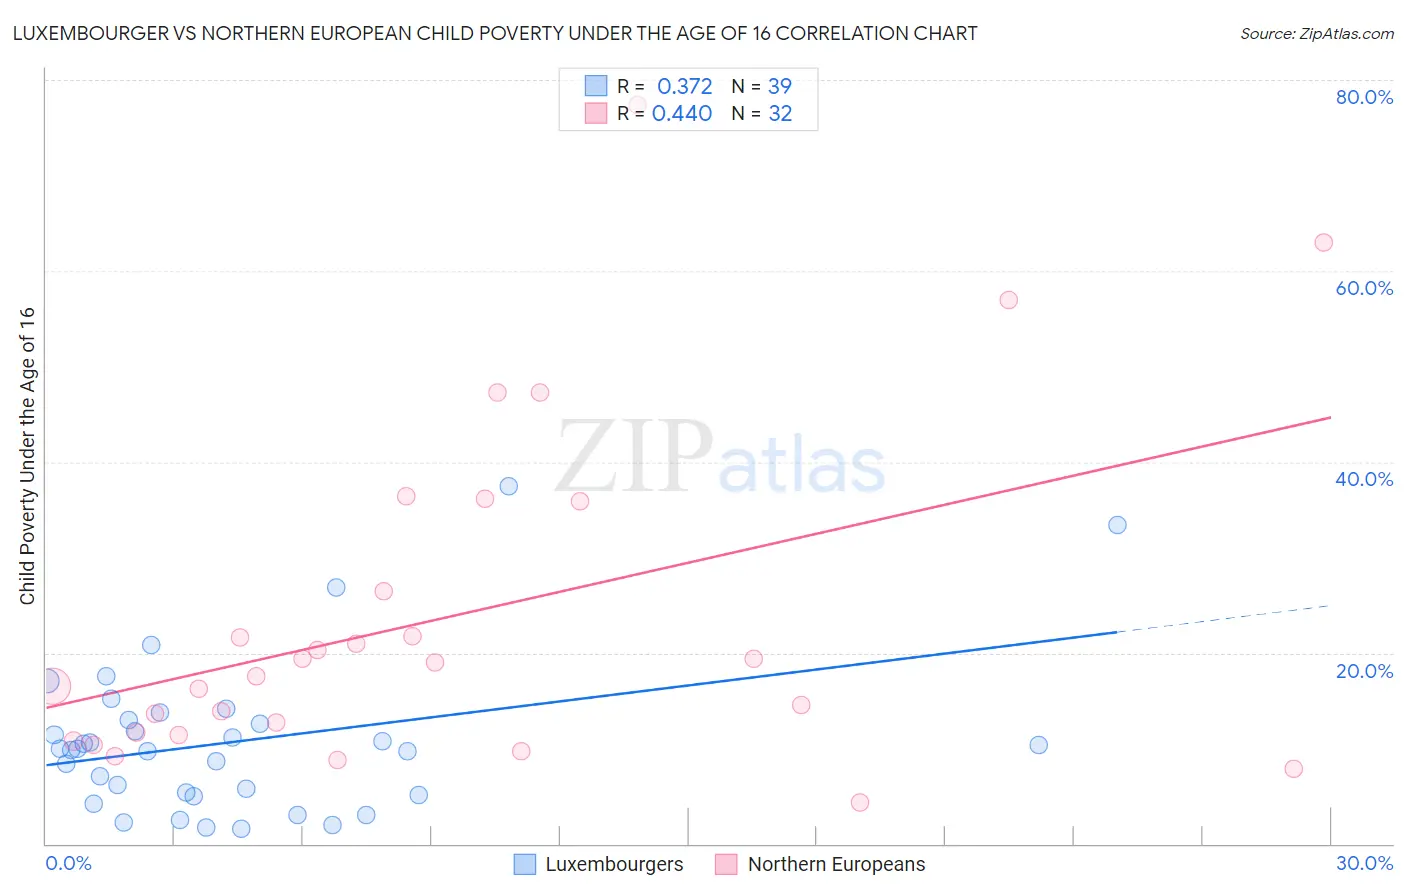
Luxembourger vs Northern European Child Poverty Under the Age of 16 Correlation Chart
The statistical analysis conducted on geographies consisting of 143,837,676 people shows a mild positive correlation between the proportion of Luxembourgers and poverty level among children under the age of 16 in the United States with a correlation coefficient (R) of 0.372 and weighted average of 13.6%. Similarly, the statistical analysis conducted on geographies consisting of 401,434,947 people shows a moderate positive correlation between the proportion of Northern Europeans and poverty level among children under the age of 16 in the United States with a correlation coefficient (R) of 0.440 and weighted average of 14.5%, a difference of 6.5%.
Child Poverty Under the Age of 16 Correlation Summary
| Measurement | Luxembourger | Northern European |
| Minimum | 1.6% | 4.3% |
| Maximum | 37.5% | 77.4% |
| Range | 35.9% | 73.0% |
| Mean | 10.7% | 23.7% |
| Median | 10.0% | 18.3% |
| Interquartile 25% (IQ1) | 5.1% | 11.5% |
| Interquartile 75% (IQ3) | 13.0% | 31.1% |
| Interquartile Range (IQR) | 7.9% | 19.6% |
| Standard Deviation (Sample) | 8.0% | 17.6% |
| Standard Deviation (Population) | 7.9% | 17.4% |
Similar Demographics by Child Poverty Under the Age of 16
Demographics Similar to Luxembourgers by Child Poverty Under the Age of 16
In terms of child poverty under the age of 16, the demographic groups most similar to Luxembourgers are Immigrants from Australia (13.6%, a difference of 0.020%), Immigrants from Bolivia (13.6%, a difference of 0.51%), Immigrants from Northern Europe (13.6%, a difference of 0.52%), Immigrants from Scotland (13.7%, a difference of 0.71%), and Lithuanian (13.5%, a difference of 0.77%).
| Demographics | Rating | Rank | Child Poverty Under the Age of 16 |
| Danes | 99.7 /100 | #31 | Exceptional 13.4% |
| Tongans | 99.7 /100 | #32 | Exceptional 13.4% |
| Asians | 99.6 /100 | #33 | Exceptional 13.5% |
| Russians | 99.6 /100 | #34 | Exceptional 13.5% |
| Lithuanians | 99.6 /100 | #35 | Exceptional 13.5% |
| Immigrants | Northern Europe | 99.6 /100 | #36 | Exceptional 13.6% |
| Immigrants | Bolivia | 99.6 /100 | #37 | Exceptional 13.6% |
| Luxembourgers | 99.5 /100 | #38 | Exceptional 13.6% |
| Immigrants | Australia | 99.5 /100 | #39 | Exceptional 13.6% |
| Immigrants | Scotland | 99.4 /100 | #40 | Exceptional 13.7% |
| Croatians | 99.4 /100 | #41 | Exceptional 13.8% |
| Immigrants | Sri Lanka | 99.3 /100 | #42 | Exceptional 13.8% |
| Immigrants | Moldova | 99.3 /100 | #43 | Exceptional 13.8% |
| Greeks | 99.3 /100 | #44 | Exceptional 13.8% |
| Czechs | 99.3 /100 | #45 | Exceptional 13.8% |
Demographics Similar to Northern Europeans by Child Poverty Under the Age of 16
In terms of child poverty under the age of 16, the demographic groups most similar to Northern Europeans are German (14.5%, a difference of 0.050%), Immigrants from Argentina (14.5%, a difference of 0.10%), Taiwanese (14.5%, a difference of 0.10%), Austrian (14.5%, a difference of 0.12%), and Soviet Union (14.5%, a difference of 0.18%).
| Demographics | Rating | Rank | Child Poverty Under the Age of 16 |
| Finns | 97.2 /100 | #81 | Exceptional 14.5% |
| Immigrants | Canada | 97.2 /100 | #82 | Exceptional 14.5% |
| Egyptians | 97.2 /100 | #83 | Exceptional 14.5% |
| Immigrants | Latvia | 97.1 /100 | #84 | Exceptional 14.5% |
| Soviet Union | 97.1 /100 | #85 | Exceptional 14.5% |
| Immigrants | Argentina | 97.1 /100 | #86 | Exceptional 14.5% |
| Taiwanese | 97.1 /100 | #87 | Exceptional 14.5% |
| Northern Europeans | 97.0 /100 | #88 | Exceptional 14.5% |
| Germans | 96.9 /100 | #89 | Exceptional 14.5% |
| Austrians | 96.9 /100 | #90 | Exceptional 14.5% |
| Immigrants | North America | 96.7 /100 | #91 | Exceptional 14.6% |
| Immigrants | Italy | 96.7 /100 | #92 | Exceptional 14.6% |
| Argentineans | 96.6 /100 | #93 | Exceptional 14.6% |
| Immigrants | South Africa | 96.3 /100 | #94 | Exceptional 14.6% |
| Immigrants | Croatia | 96.1 /100 | #95 | Exceptional 14.6% |