Immigrants from Liberia vs Northern European Child Poverty Under the Age of 16
COMPARE
Immigrants from Liberia
Northern European
Child Poverty Under the Age of 16
Child Poverty Under the Age of 16 Comparison
Immigrants from Liberia
Northern Europeans
19.7%
CHILD POVERTY UNDER THE AGE OF 16
0.1/ 100
METRIC RATING
271st/ 347
METRIC RANK
14.5%
CHILD POVERTY UNDER THE AGE OF 16
97.0/ 100
METRIC RATING
88th/ 347
METRIC RANK
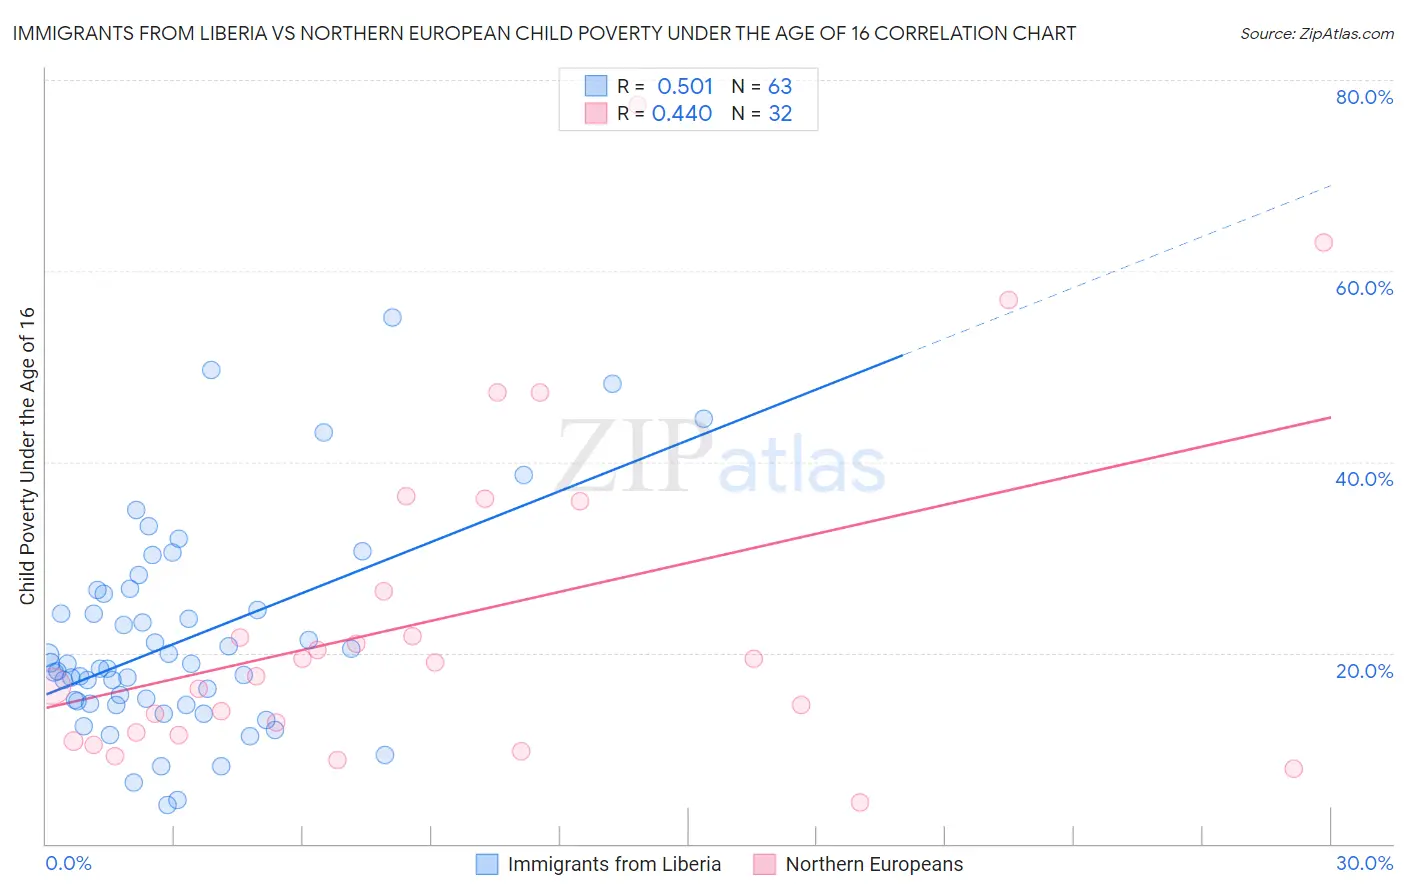
Immigrants from Liberia vs Northern European Child Poverty Under the Age of 16 Correlation Chart
The statistical analysis conducted on geographies consisting of 135,039,735 people shows a substantial positive correlation between the proportion of Immigrants from Liberia and poverty level among children under the age of 16 in the United States with a correlation coefficient (R) of 0.501 and weighted average of 19.7%. Similarly, the statistical analysis conducted on geographies consisting of 401,434,947 people shows a moderate positive correlation between the proportion of Northern Europeans and poverty level among children under the age of 16 in the United States with a correlation coefficient (R) of 0.440 and weighted average of 14.5%, a difference of 35.8%.
Child Poverty Under the Age of 16 Correlation Summary
| Measurement | Immigrants from Liberia | Northern European |
| Minimum | 4.0% | 4.3% |
| Maximum | 55.1% | 77.4% |
| Range | 51.1% | 73.0% |
| Mean | 21.3% | 23.7% |
| Median | 18.4% | 18.3% |
| Interquartile 25% (IQ1) | 14.6% | 11.5% |
| Interquartile 75% (IQ3) | 26.1% | 31.1% |
| Interquartile Range (IQR) | 11.5% | 19.6% |
| Standard Deviation (Sample) | 10.8% | 17.6% |
| Standard Deviation (Population) | 10.7% | 17.4% |
Similar Demographics by Child Poverty Under the Age of 16
Demographics Similar to Immigrants from Liberia by Child Poverty Under the Age of 16
In terms of child poverty under the age of 16, the demographic groups most similar to Immigrants from Liberia are Spanish American Indian (19.7%, a difference of 0.13%), Immigrants from El Salvador (19.7%, a difference of 0.15%), Jamaican (19.7%, a difference of 0.21%), Immigrants from Bangladesh (19.8%, a difference of 0.31%), and Immigrants from Jamaica (19.8%, a difference of 0.54%).
| Demographics | Rating | Rank | Child Poverty Under the Age of 16 |
| Immigrants | Ecuador | 0.1 /100 | #264 | Tragic 19.4% |
| Chickasaw | 0.1 /100 | #265 | Tragic 19.5% |
| Liberians | 0.1 /100 | #266 | Tragic 19.5% |
| Cherokee | 0.1 /100 | #267 | Tragic 19.5% |
| Jamaicans | 0.1 /100 | #268 | Tragic 19.7% |
| Immigrants | El Salvador | 0.1 /100 | #269 | Tragic 19.7% |
| Spanish American Indians | 0.1 /100 | #270 | Tragic 19.7% |
| Immigrants | Liberia | 0.1 /100 | #271 | Tragic 19.7% |
| Immigrants | Bangladesh | 0.1 /100 | #272 | Tragic 19.8% |
| Immigrants | Jamaica | 0.1 /100 | #273 | Tragic 19.8% |
| Immigrants | Cabo Verde | 0.1 /100 | #274 | Tragic 19.9% |
| Immigrants | Barbados | 0.1 /100 | #275 | Tragic 19.9% |
| Belizeans | 0.1 /100 | #276 | Tragic 19.9% |
| Iroquois | 0.1 /100 | #277 | Tragic 19.9% |
| Bangladeshis | 0.0 /100 | #278 | Tragic 19.9% |
Demographics Similar to Northern Europeans by Child Poverty Under the Age of 16
In terms of child poverty under the age of 16, the demographic groups most similar to Northern Europeans are German (14.5%, a difference of 0.050%), Immigrants from Argentina (14.5%, a difference of 0.10%), Taiwanese (14.5%, a difference of 0.10%), Austrian (14.5%, a difference of 0.12%), and Soviet Union (14.5%, a difference of 0.18%).
| Demographics | Rating | Rank | Child Poverty Under the Age of 16 |
| Finns | 97.2 /100 | #81 | Exceptional 14.5% |
| Immigrants | Canada | 97.2 /100 | #82 | Exceptional 14.5% |
| Egyptians | 97.2 /100 | #83 | Exceptional 14.5% |
| Immigrants | Latvia | 97.1 /100 | #84 | Exceptional 14.5% |
| Soviet Union | 97.1 /100 | #85 | Exceptional 14.5% |
| Immigrants | Argentina | 97.1 /100 | #86 | Exceptional 14.5% |
| Taiwanese | 97.1 /100 | #87 | Exceptional 14.5% |
| Northern Europeans | 97.0 /100 | #88 | Exceptional 14.5% |
| Germans | 96.9 /100 | #89 | Exceptional 14.5% |
| Austrians | 96.9 /100 | #90 | Exceptional 14.5% |
| Immigrants | North America | 96.7 /100 | #91 | Exceptional 14.6% |
| Immigrants | Italy | 96.7 /100 | #92 | Exceptional 14.6% |
| Argentineans | 96.6 /100 | #93 | Exceptional 14.6% |
| Immigrants | South Africa | 96.3 /100 | #94 | Exceptional 14.6% |
| Immigrants | Croatia | 96.1 /100 | #95 | Exceptional 14.6% |