British West Indian vs Immigrants from Latvia Female Poverty Among 25-34 Year Olds
COMPARE
British West Indian
Immigrants from Latvia
Female Poverty Among 25-34 Year Olds
Female Poverty Among 25-34 Year Olds Comparison
British West Indians
Immigrants from Latvia
15.6%
FEMALE POVERTY AMONG 25-34 YEAR OLDS
0.1/ 100
METRIC RATING
270th/ 347
METRIC RANK
12.5%
FEMALE POVERTY AMONG 25-34 YEAR OLDS
97.7/ 100
METRIC RATING
84th/ 347
METRIC RANK
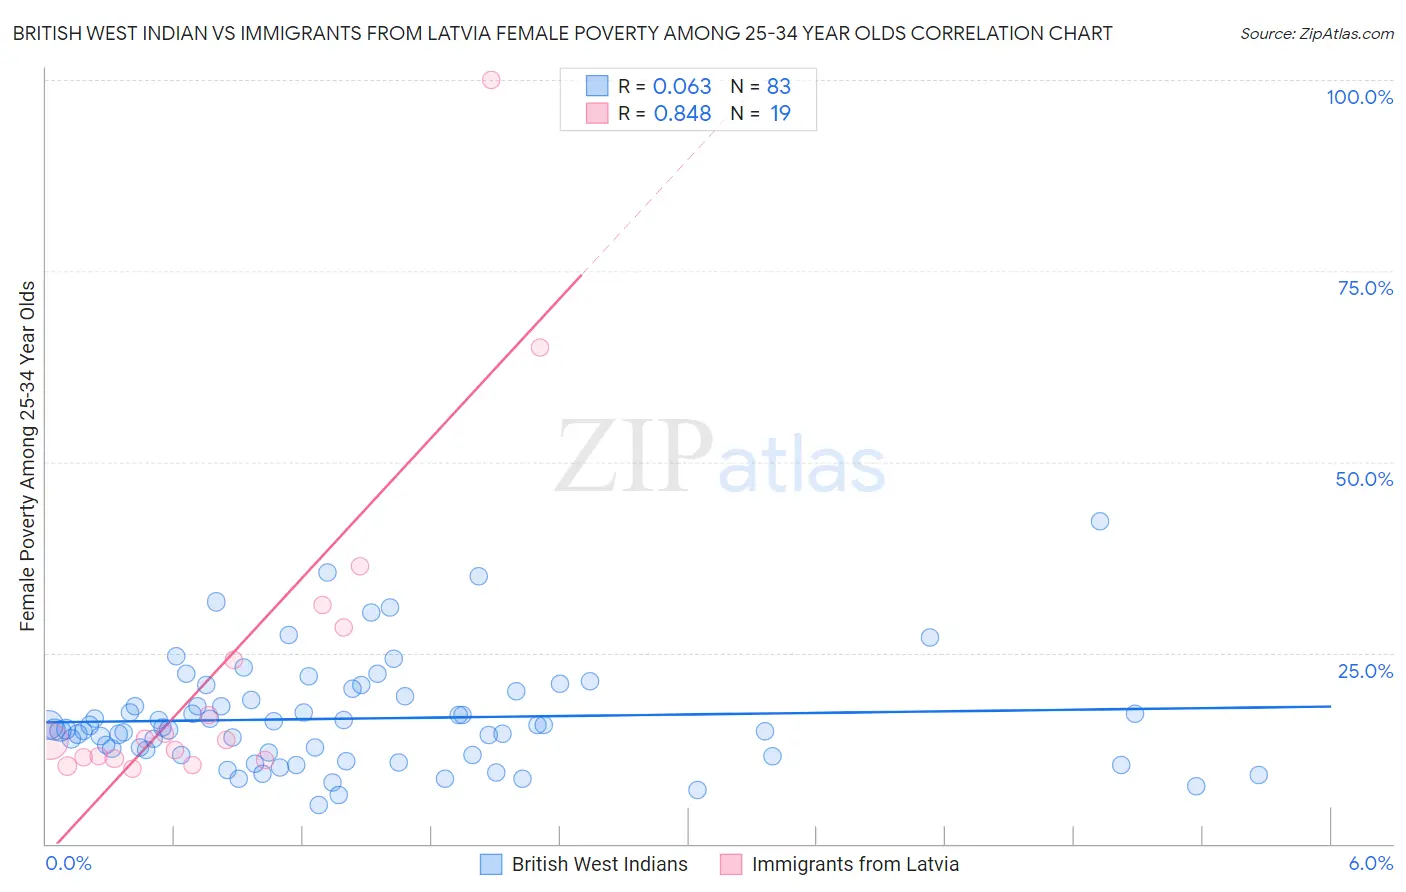
British West Indian vs Immigrants from Latvia Female Poverty Among 25-34 Year Olds Correlation Chart
The statistical analysis conducted on geographies consisting of 152,061,262 people shows a slight positive correlation between the proportion of British West Indians and poverty level among females between the ages 25 and 34 in the United States with a correlation coefficient (R) of 0.063 and weighted average of 15.6%. Similarly, the statistical analysis conducted on geographies consisting of 113,031,058 people shows a very strong positive correlation between the proportion of Immigrants from Latvia and poverty level among females between the ages 25 and 34 in the United States with a correlation coefficient (R) of 0.848 and weighted average of 12.5%, a difference of 25.1%.
Female Poverty Among 25-34 Year Olds Correlation Summary
| Measurement | British West Indian | Immigrants from Latvia |
| Minimum | 5.1% | 9.8% |
| Maximum | 42.1% | 100.0% |
| Range | 37.1% | 90.2% |
| Mean | 16.4% | 23.4% |
| Median | 15.0% | 13.6% |
| Interquartile 25% (IQ1) | 11.7% | 11.1% |
| Interquartile 75% (IQ3) | 19.2% | 28.4% |
| Interquartile Range (IQR) | 7.5% | 17.3% |
| Standard Deviation (Sample) | 6.9% | 23.0% |
| Standard Deviation (Population) | 6.9% | 22.4% |
Similar Demographics by Female Poverty Among 25-34 Year Olds
Demographics Similar to British West Indians by Female Poverty Among 25-34 Year Olds
In terms of female poverty among 25-34 year olds, the demographic groups most similar to British West Indians are Cree (15.6%, a difference of 0.010%), Senegalese (15.6%, a difference of 0.070%), Subsaharan African (15.6%, a difference of 0.15%), Nonimmigrants (15.6%, a difference of 0.18%), and Immigrants from Senegal (15.6%, a difference of 0.36%).
| Demographics | Rating | Rank | Female Poverty Among 25-34 Year Olds |
| Mexican American Indians | 0.2 /100 | #263 | Tragic 15.4% |
| Pennsylvania Germans | 0.1 /100 | #264 | Tragic 15.4% |
| Immigrants | Liberia | 0.1 /100 | #265 | Tragic 15.4% |
| Immigrants | Somalia | 0.1 /100 | #266 | Tragic 15.4% |
| Central Americans | 0.1 /100 | #267 | Tragic 15.5% |
| Immigrants | Senegal | 0.1 /100 | #268 | Tragic 15.6% |
| Sub-Saharan Africans | 0.1 /100 | #269 | Tragic 15.6% |
| British West Indians | 0.1 /100 | #270 | Tragic 15.6% |
| Cree | 0.1 /100 | #271 | Tragic 15.6% |
| Senegalese | 0.1 /100 | #272 | Tragic 15.6% |
| Immigrants | Nonimmigrants | 0.1 /100 | #273 | Tragic 15.6% |
| Immigrants | Caribbean | 0.0 /100 | #274 | Tragic 15.7% |
| Immigrants | Azores | 0.0 /100 | #275 | Tragic 15.8% |
| Immigrants | Zaire | 0.0 /100 | #276 | Tragic 15.8% |
| Immigrants | Micronesia | 0.0 /100 | #277 | Tragic 15.8% |
Demographics Similar to Immigrants from Latvia by Female Poverty Among 25-34 Year Olds
In terms of female poverty among 25-34 year olds, the demographic groups most similar to Immigrants from Latvia are Albanian (12.5%, a difference of 0.060%), Immigrants from South Eastern Asia (12.5%, a difference of 0.11%), Croatian (12.5%, a difference of 0.13%), Argentinean (12.5%, a difference of 0.15%), and Immigrants from Austria (12.5%, a difference of 0.23%).
| Demographics | Rating | Rank | Female Poverty Among 25-34 Year Olds |
| Immigrants | Italy | 98.8 /100 | #77 | Exceptional 12.3% |
| Immigrants | Ukraine | 98.6 /100 | #78 | Exceptional 12.3% |
| Immigrants | Jordan | 98.5 /100 | #79 | Exceptional 12.4% |
| Immigrants | Malaysia | 98.3 /100 | #80 | Exceptional 12.4% |
| Immigrants | Kazakhstan | 98.1 /100 | #81 | Exceptional 12.4% |
| Ethiopians | 98.0 /100 | #82 | Exceptional 12.4% |
| Albanians | 97.7 /100 | #83 | Exceptional 12.5% |
| Immigrants | Latvia | 97.7 /100 | #84 | Exceptional 12.5% |
| Immigrants | South Eastern Asia | 97.6 /100 | #85 | Exceptional 12.5% |
| Croatians | 97.5 /100 | #86 | Exceptional 12.5% |
| Argentineans | 97.5 /100 | #87 | Exceptional 12.5% |
| Immigrants | Austria | 97.4 /100 | #88 | Exceptional 12.5% |
| Italians | 97.2 /100 | #89 | Exceptional 12.5% |
| Immigrants | Albania | 97.1 /100 | #90 | Exceptional 12.5% |
| Norwegians | 96.9 /100 | #91 | Exceptional 12.6% |