Kenyan vs Iroquois Female Poverty Among 18-24 Year Olds
COMPARE
Kenyan
Iroquois
Female Poverty Among 18-24 Year Olds
Female Poverty Among 18-24 Year Olds Comparison
Kenyans
Iroquois
20.2%
FEMALE POVERTY AMONG 18-24 YEAR OLDS
44.9/ 100
METRIC RATING
176th/ 347
METRIC RANK
22.9%
FEMALE POVERTY AMONG 18-24 YEAR OLDS
0.0/ 100
METRIC RATING
302nd/ 347
METRIC RANK
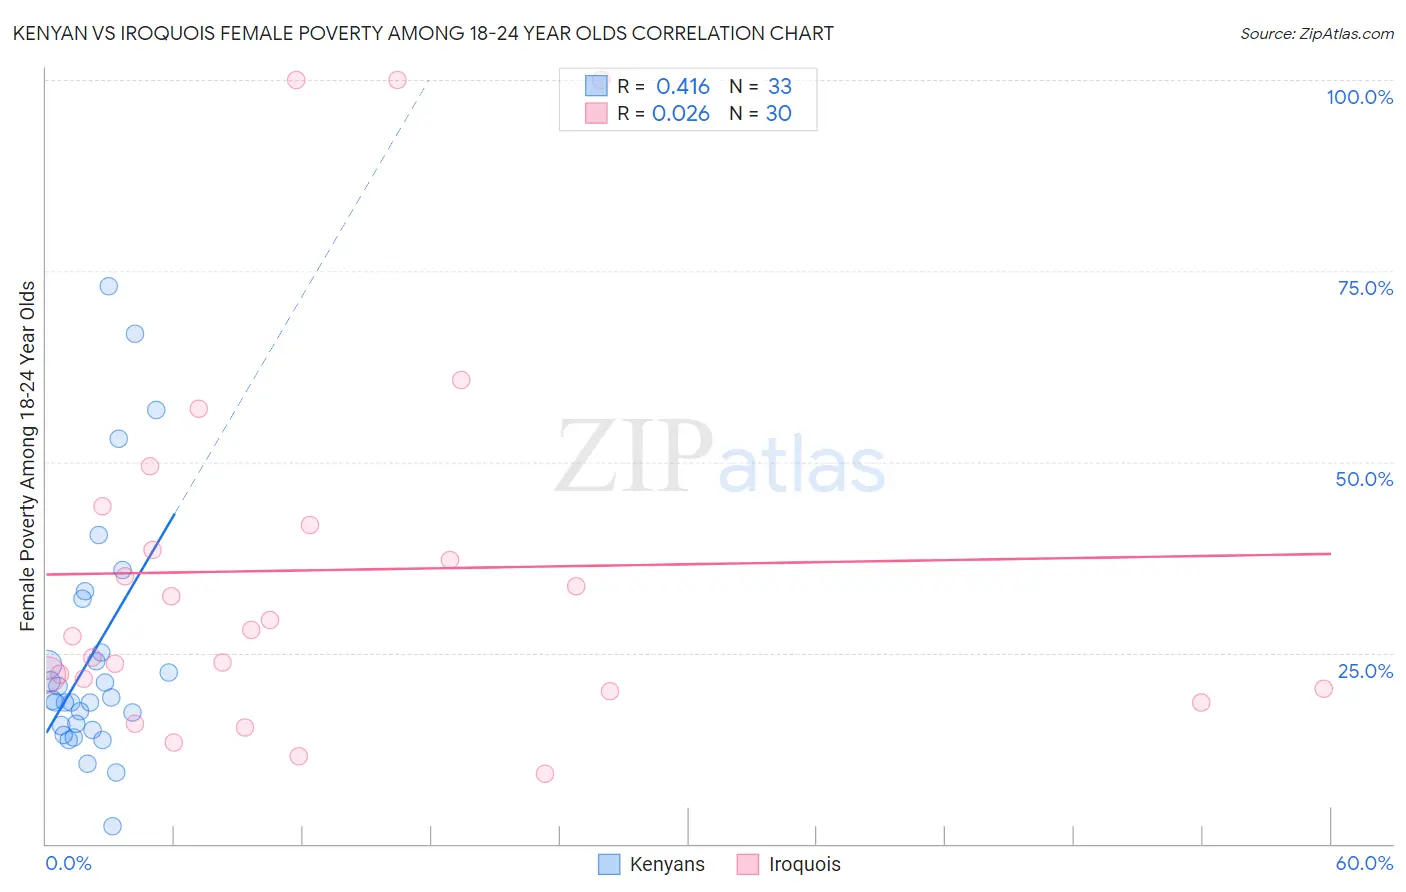
Kenyan vs Iroquois Female Poverty Among 18-24 Year Olds Correlation Chart
The statistical analysis conducted on geographies consisting of 166,879,823 people shows a moderate positive correlation between the proportion of Kenyans and poverty level among females between the ages 18 and 24 in the United States with a correlation coefficient (R) of 0.416 and weighted average of 20.2%. Similarly, the statistical analysis conducted on geographies consisting of 204,291,578 people shows no correlation between the proportion of Iroquois and poverty level among females between the ages 18 and 24 in the United States with a correlation coefficient (R) of 0.026 and weighted average of 22.9%, a difference of 13.9%.
Female Poverty Among 18-24 Year Olds Correlation Summary
| Measurement | Kenyan | Iroquois |
| Minimum | 2.2% | 9.2% |
| Maximum | 73.0% | 100.0% |
| Range | 70.8% | 90.8% |
| Mean | 24.8% | 35.8% |
| Median | 18.8% | 27.6% |
| Interquartile 25% (IQ1) | 15.2% | 20.3% |
| Interquartile 75% (IQ3) | 28.5% | 41.7% |
| Interquartile Range (IQR) | 13.3% | 21.4% |
| Standard Deviation (Sample) | 16.3% | 25.2% |
| Standard Deviation (Population) | 16.0% | 24.7% |
Similar Demographics by Female Poverty Among 18-24 Year Olds
Demographics Similar to Kenyans by Female Poverty Among 18-24 Year Olds
In terms of female poverty among 18-24 year olds, the demographic groups most similar to Kenyans are Immigrants from Kazakhstan (20.2%, a difference of 0.040%), Swiss (20.2%, a difference of 0.040%), Ethiopian (20.2%, a difference of 0.060%), Iraqi (20.2%, a difference of 0.080%), and Immigrants from China (20.2%, a difference of 0.10%).
| Demographics | Rating | Rank | Female Poverty Among 18-24 Year Olds |
| Hmong | 55.4 /100 | #169 | Average 20.0% |
| Iranians | 54.7 /100 | #170 | Average 20.1% |
| Immigrants | Nigeria | 54.3 /100 | #171 | Average 20.1% |
| Belizeans | 52.0 /100 | #172 | Average 20.1% |
| Irish | 50.0 /100 | #173 | Average 20.1% |
| Swedes | 50.0 /100 | #174 | Average 20.1% |
| South American Indians | 48.4 /100 | #175 | Average 20.1% |
| Kenyans | 44.9 /100 | #176 | Average 20.2% |
| Immigrants | Kazakhstan | 44.2 /100 | #177 | Average 20.2% |
| Swiss | 44.0 /100 | #178 | Average 20.2% |
| Ethiopians | 43.8 /100 | #179 | Average 20.2% |
| Iraqis | 43.3 /100 | #180 | Average 20.2% |
| Immigrants | China | 43.0 /100 | #181 | Average 20.2% |
| Immigrants | Barbados | 42.8 /100 | #182 | Average 20.2% |
| Lebanese | 40.6 /100 | #183 | Average 20.2% |
Demographics Similar to Iroquois by Female Poverty Among 18-24 Year Olds
In terms of female poverty among 18-24 year olds, the demographic groups most similar to Iroquois are Senegalese (23.0%, a difference of 0.15%), Sudanese (23.0%, a difference of 0.30%), Immigrants from Kuwait (23.0%, a difference of 0.35%), Seminole (22.9%, a difference of 0.39%), and African (22.8%, a difference of 0.48%).
| Demographics | Rating | Rank | Female Poverty Among 18-24 Year Olds |
| Shoshone | 0.0 /100 | #295 | Tragic 22.5% |
| Menominee | 0.0 /100 | #296 | Tragic 22.5% |
| Inupiat | 0.0 /100 | #297 | Tragic 22.6% |
| Central American Indians | 0.0 /100 | #298 | Tragic 22.6% |
| Cherokee | 0.0 /100 | #299 | Tragic 22.7% |
| Africans | 0.0 /100 | #300 | Tragic 22.8% |
| Seminole | 0.0 /100 | #301 | Tragic 22.9% |
| Iroquois | 0.0 /100 | #302 | Tragic 22.9% |
| Senegalese | 0.0 /100 | #303 | Tragic 23.0% |
| Sudanese | 0.0 /100 | #304 | Tragic 23.0% |
| Immigrants | Kuwait | 0.0 /100 | #305 | Tragic 23.0% |
| Paiute | 0.0 /100 | #306 | Tragic 23.3% |
| Cree | 0.0 /100 | #307 | Tragic 23.4% |
| Immigrants | Sudan | 0.0 /100 | #308 | Tragic 23.5% |
| Blackfeet | 0.0 /100 | #309 | Tragic 23.6% |