Kenyan vs African Female Poverty Among 18-24 Year Olds
COMPARE
Kenyan
African
Female Poverty Among 18-24 Year Olds
Female Poverty Among 18-24 Year Olds Comparison
Kenyans
Africans
20.2%
FEMALE POVERTY AMONG 18-24 YEAR OLDS
44.9/ 100
METRIC RATING
176th/ 347
METRIC RANK
22.8%
FEMALE POVERTY AMONG 18-24 YEAR OLDS
0.0/ 100
METRIC RATING
300th/ 347
METRIC RANK
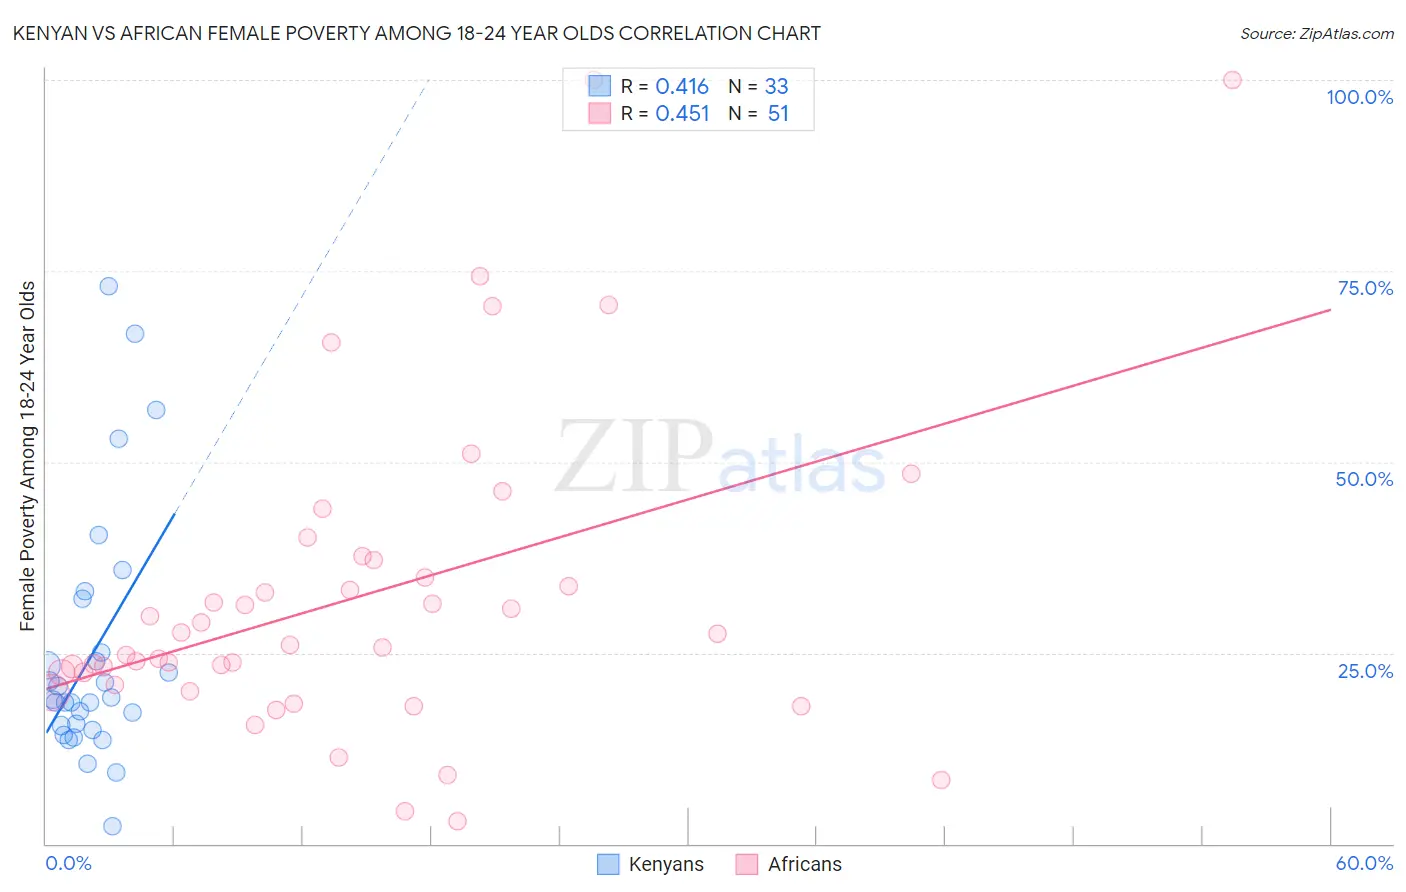
Kenyan vs African Female Poverty Among 18-24 Year Olds Correlation Chart
The statistical analysis conducted on geographies consisting of 166,879,823 people shows a moderate positive correlation between the proportion of Kenyans and poverty level among females between the ages 18 and 24 in the United States with a correlation coefficient (R) of 0.416 and weighted average of 20.2%. Similarly, the statistical analysis conducted on geographies consisting of 458,558,790 people shows a moderate positive correlation between the proportion of Africans and poverty level among females between the ages 18 and 24 in the United States with a correlation coefficient (R) of 0.451 and weighted average of 22.8%, a difference of 13.3%.
Female Poverty Among 18-24 Year Olds Correlation Summary
| Measurement | Kenyan | African |
| Minimum | 2.2% | 2.9% |
| Maximum | 73.0% | 100.0% |
| Range | 70.8% | 97.1% |
| Mean | 24.8% | 32.4% |
| Median | 18.8% | 26.0% |
| Interquartile 25% (IQ1) | 15.2% | 20.8% |
| Interquartile 75% (IQ3) | 28.5% | 37.2% |
| Interquartile Range (IQR) | 13.3% | 16.4% |
| Standard Deviation (Sample) | 16.3% | 20.9% |
| Standard Deviation (Population) | 16.0% | 20.7% |
Similar Demographics by Female Poverty Among 18-24 Year Olds
Demographics Similar to Kenyans by Female Poverty Among 18-24 Year Olds
In terms of female poverty among 18-24 year olds, the demographic groups most similar to Kenyans are Immigrants from Kazakhstan (20.2%, a difference of 0.040%), Swiss (20.2%, a difference of 0.040%), Ethiopian (20.2%, a difference of 0.060%), Iraqi (20.2%, a difference of 0.080%), and Immigrants from China (20.2%, a difference of 0.10%).
| Demographics | Rating | Rank | Female Poverty Among 18-24 Year Olds |
| Hmong | 55.4 /100 | #169 | Average 20.0% |
| Iranians | 54.7 /100 | #170 | Average 20.1% |
| Immigrants | Nigeria | 54.3 /100 | #171 | Average 20.1% |
| Belizeans | 52.0 /100 | #172 | Average 20.1% |
| Irish | 50.0 /100 | #173 | Average 20.1% |
| Swedes | 50.0 /100 | #174 | Average 20.1% |
| South American Indians | 48.4 /100 | #175 | Average 20.1% |
| Kenyans | 44.9 /100 | #176 | Average 20.2% |
| Immigrants | Kazakhstan | 44.2 /100 | #177 | Average 20.2% |
| Swiss | 44.0 /100 | #178 | Average 20.2% |
| Ethiopians | 43.8 /100 | #179 | Average 20.2% |
| Iraqis | 43.3 /100 | #180 | Average 20.2% |
| Immigrants | China | 43.0 /100 | #181 | Average 20.2% |
| Immigrants | Barbados | 42.8 /100 | #182 | Average 20.2% |
| Lebanese | 40.6 /100 | #183 | Average 20.2% |
Demographics Similar to Africans by Female Poverty Among 18-24 Year Olds
In terms of female poverty among 18-24 year olds, the demographic groups most similar to Africans are Seminole (22.9%, a difference of 0.090%), Iroquois (22.9%, a difference of 0.48%), Senegalese (23.0%, a difference of 0.63%), Cherokee (22.7%, a difference of 0.72%), and Sudanese (23.0%, a difference of 0.77%).
| Demographics | Rating | Rank | Female Poverty Among 18-24 Year Olds |
| U.S. Virgin Islanders | 0.0 /100 | #293 | Tragic 22.5% |
| Indonesians | 0.0 /100 | #294 | Tragic 22.5% |
| Shoshone | 0.0 /100 | #295 | Tragic 22.5% |
| Menominee | 0.0 /100 | #296 | Tragic 22.5% |
| Inupiat | 0.0 /100 | #297 | Tragic 22.6% |
| Central American Indians | 0.0 /100 | #298 | Tragic 22.6% |
| Cherokee | 0.0 /100 | #299 | Tragic 22.7% |
| Africans | 0.0 /100 | #300 | Tragic 22.8% |
| Seminole | 0.0 /100 | #301 | Tragic 22.9% |
| Iroquois | 0.0 /100 | #302 | Tragic 22.9% |
| Senegalese | 0.0 /100 | #303 | Tragic 23.0% |
| Sudanese | 0.0 /100 | #304 | Tragic 23.0% |
| Immigrants | Kuwait | 0.0 /100 | #305 | Tragic 23.0% |
| Paiute | 0.0 /100 | #306 | Tragic 23.3% |
| Cree | 0.0 /100 | #307 | Tragic 23.4% |