Basque vs Barbadian Receiving Food Stamps
COMPARE
Basque
Barbadian
Receiving Food Stamps
Receiving Food Stamps Comparison
Basques
Barbadians
10.3%
RECEIVING FOOD STAMPS
97.4/ 100
METRIC RATING
95th/ 347
METRIC RANK
16.5%
RECEIVING FOOD STAMPS
0.0/ 100
METRIC RATING
308th/ 347
METRIC RANK
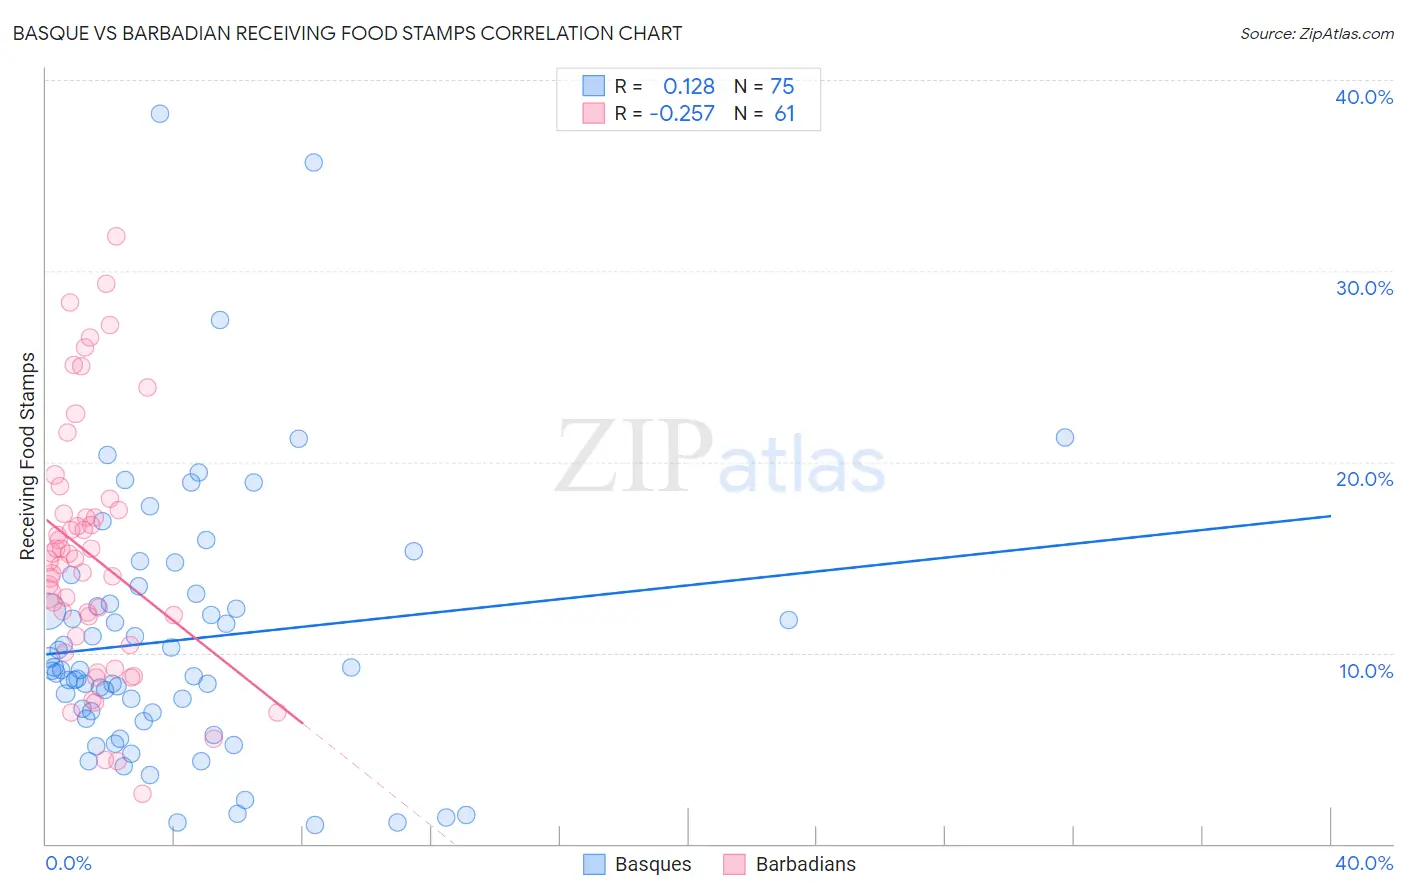
Basque vs Barbadian Receiving Food Stamps Correlation Chart
The statistical analysis conducted on geographies consisting of 165,638,020 people shows a poor positive correlation between the proportion of Basques and percentage of population receiving government assistance and/or food stamps in the United States with a correlation coefficient (R) of 0.128 and weighted average of 10.3%. Similarly, the statistical analysis conducted on geographies consisting of 141,159,884 people shows a weak negative correlation between the proportion of Barbadians and percentage of population receiving government assistance and/or food stamps in the United States with a correlation coefficient (R) of -0.257 and weighted average of 16.5%, a difference of 60.8%.
Receiving Food Stamps Correlation Summary
| Measurement | Basque | Barbadian |
| Minimum | 1.0% | 2.6% |
| Maximum | 38.2% | 31.8% |
| Range | 37.2% | 29.2% |
| Mean | 10.7% | 15.1% |
| Median | 9.1% | 14.8% |
| Interquartile 25% (IQ1) | 6.5% | 10.6% |
| Interquartile 75% (IQ3) | 13.1% | 17.4% |
| Interquartile Range (IQR) | 6.6% | 6.8% |
| Standard Deviation (Sample) | 7.0% | 6.5% |
| Standard Deviation (Population) | 6.9% | 6.5% |
Similar Demographics by Receiving Food Stamps
Demographics Similar to Basques by Receiving Food Stamps
In terms of receiving food stamps, the demographic groups most similar to Basques are Immigrants from Greece (10.3%, a difference of 0.030%), Welsh (10.3%, a difference of 0.050%), Czechoslovakian (10.3%, a difference of 0.31%), Immigrants from Egypt (10.3%, a difference of 0.37%), and Serbian (10.3%, a difference of 0.54%).
| Demographics | Rating | Rank | Receiving Food Stamps |
| Immigrants | Kuwait | 98.4 /100 | #88 | Exceptional 10.0% |
| Immigrants | France | 98.3 /100 | #89 | Exceptional 10.1% |
| Finns | 97.9 /100 | #90 | Exceptional 10.2% |
| Jordanians | 97.9 /100 | #91 | Exceptional 10.2% |
| Irish | 97.9 /100 | #92 | Exceptional 10.2% |
| Belgians | 97.7 /100 | #93 | Exceptional 10.2% |
| Immigrants | Greece | 97.4 /100 | #94 | Exceptional 10.3% |
| Basques | 97.4 /100 | #95 | Exceptional 10.3% |
| Welsh | 97.3 /100 | #96 | Exceptional 10.3% |
| Czechoslovakians | 97.2 /100 | #97 | Exceptional 10.3% |
| Immigrants | Egypt | 97.1 /100 | #98 | Exceptional 10.3% |
| Serbians | 97.0 /100 | #99 | Exceptional 10.3% |
| Immigrants | Western Europe | 96.9 /100 | #100 | Exceptional 10.3% |
| Palestinians | 96.9 /100 | #101 | Exceptional 10.3% |
| Immigrants | Europe | 96.8 /100 | #102 | Exceptional 10.3% |
Demographics Similar to Barbadians by Receiving Food Stamps
In terms of receiving food stamps, the demographic groups most similar to Barbadians are U.S. Virgin Islander (16.5%, a difference of 0.24%), Houma (16.5%, a difference of 0.26%), Jamaican (16.4%, a difference of 0.55%), Immigrants from the Azores (16.4%, a difference of 0.62%), and Immigrants from Barbados (16.6%, a difference of 0.79%).
| Demographics | Rating | Rank | Receiving Food Stamps |
| Trinidadians and Tobagonians | 0.0 /100 | #301 | Tragic 16.0% |
| Immigrants | West Indies | 0.0 /100 | #302 | Tragic 16.1% |
| Nicaraguans | 0.0 /100 | #303 | Tragic 16.1% |
| West Indians | 0.0 /100 | #304 | Tragic 16.3% |
| Immigrants | Azores | 0.0 /100 | #305 | Tragic 16.4% |
| Jamaicans | 0.0 /100 | #306 | Tragic 16.4% |
| Houma | 0.0 /100 | #307 | Tragic 16.5% |
| Barbadians | 0.0 /100 | #308 | Tragic 16.5% |
| U.S. Virgin Islanders | 0.0 /100 | #309 | Tragic 16.5% |
| Immigrants | Barbados | 0.0 /100 | #310 | Tragic 16.6% |
| Guyanese | 0.0 /100 | #311 | Tragic 16.7% |
| Sioux | 0.0 /100 | #312 | Tragic 16.8% |
| Immigrants | Jamaica | 0.0 /100 | #313 | Tragic 16.9% |
| Immigrants | Guyana | 0.0 /100 | #314 | Tragic 16.9% |
| Bahamians | 0.0 /100 | #315 | Tragic 17.0% |