Japanese vs Lebanese Child Poverty Under the Age of 16
COMPARE
Japanese
Lebanese
Child Poverty Under the Age of 16
Child Poverty Under the Age of 16 Comparison
Japanese
Lebanese
17.7%
CHILD POVERTY UNDER THE AGE OF 16
4.7/ 100
METRIC RATING
219th/ 347
METRIC RANK
16.3%
CHILD POVERTY UNDER THE AGE OF 16
45.9/ 100
METRIC RATING
176th/ 347
METRIC RANK
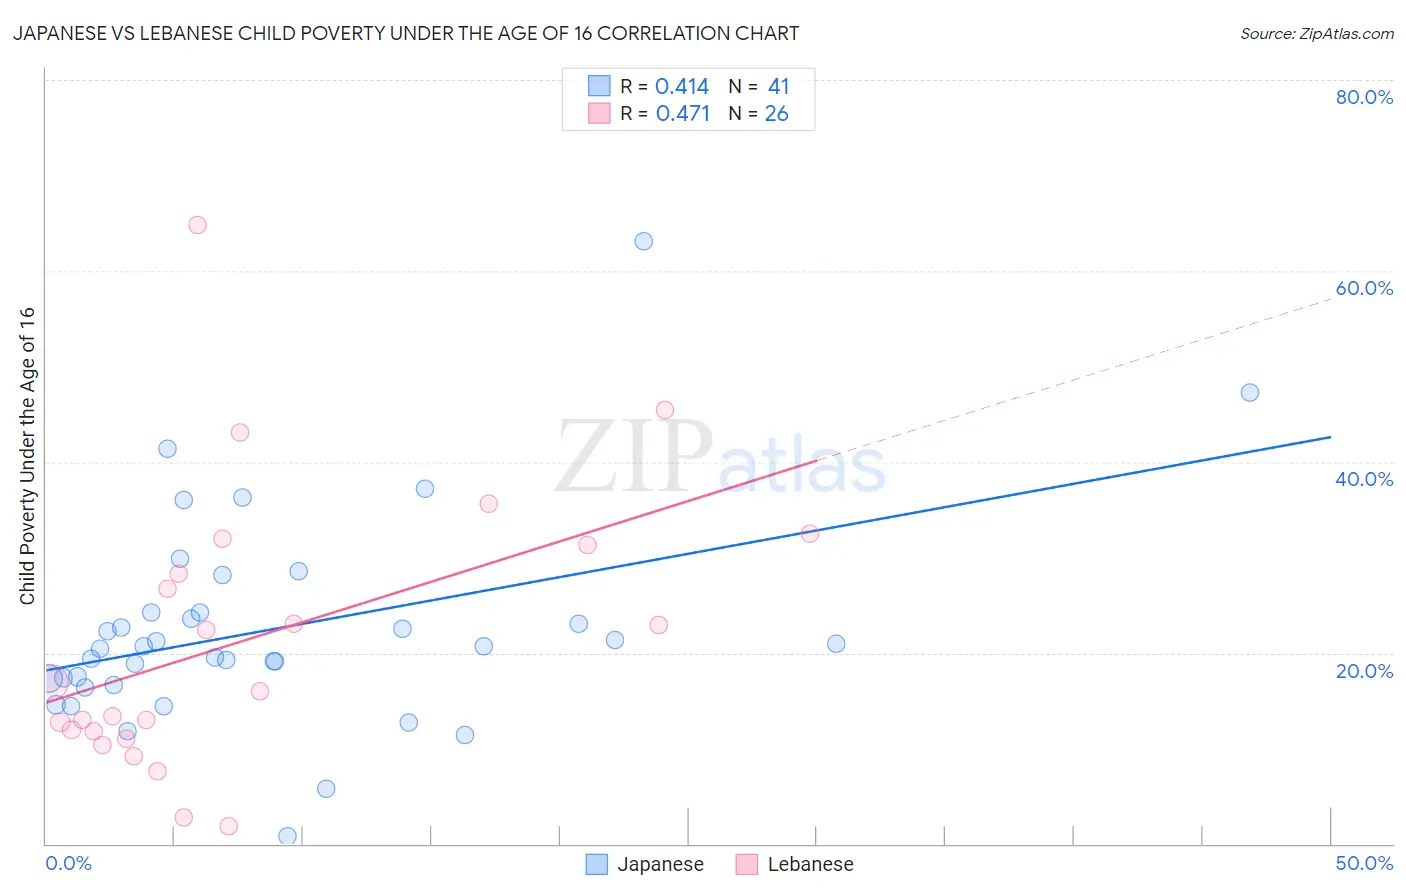
Japanese vs Lebanese Child Poverty Under the Age of 16 Correlation Chart
The statistical analysis conducted on geographies consisting of 248,294,497 people shows a moderate positive correlation between the proportion of Japanese and poverty level among children under the age of 16 in the United States with a correlation coefficient (R) of 0.414 and weighted average of 17.7%. Similarly, the statistical analysis conducted on geographies consisting of 397,248,184 people shows a moderate positive correlation between the proportion of Lebanese and poverty level among children under the age of 16 in the United States with a correlation coefficient (R) of 0.471 and weighted average of 16.3%, a difference of 8.5%.
Child Poverty Under the Age of 16 Correlation Summary
| Measurement | Japanese | Lebanese |
| Minimum | 0.73% | 1.9% |
| Maximum | 63.1% | 64.8% |
| Range | 62.3% | 63.0% |
| Mean | 22.5% | 21.5% |
| Median | 20.6% | 16.5% |
| Interquartile 25% (IQ1) | 16.9% | 11.8% |
| Interquartile 75% (IQ3) | 24.2% | 31.3% |
| Interquartile Range (IQR) | 7.3% | 19.5% |
| Standard Deviation (Sample) | 11.0% | 14.6% |
| Standard Deviation (Population) | 10.9% | 14.4% |
Similar Demographics by Child Poverty Under the Age of 16
Demographics Similar to Japanese by Child Poverty Under the Age of 16
In terms of child poverty under the age of 16, the demographic groups most similar to Japanese are Moroccan (17.6%, a difference of 0.36%), Immigrants from Eastern Africa (17.6%, a difference of 0.37%), Immigrants from Panama (17.7%, a difference of 0.40%), Sierra Leonean (17.6%, a difference of 0.56%), and Malaysian (17.5%, a difference of 0.67%).
| Demographics | Rating | Rank | Child Poverty Under the Age of 16 |
| Immigrants | Immigrants | 6.5 /100 | #212 | Tragic 17.5% |
| Immigrants | Azores | 6.2 /100 | #213 | Tragic 17.5% |
| Iraqis | 5.9 /100 | #214 | Tragic 17.5% |
| Malaysians | 5.9 /100 | #215 | Tragic 17.5% |
| Sierra Leoneans | 5.7 /100 | #216 | Tragic 17.6% |
| Immigrants | Eastern Africa | 5.3 /100 | #217 | Tragic 17.6% |
| Moroccans | 5.3 /100 | #218 | Tragic 17.6% |
| Japanese | 4.7 /100 | #219 | Tragic 17.7% |
| Immigrants | Panama | 4.1 /100 | #220 | Tragic 17.7% |
| Cubans | 3.7 /100 | #221 | Tragic 17.8% |
| Immigrants | Armenia | 3.6 /100 | #222 | Tragic 17.8% |
| Immigrants | Cambodia | 3.3 /100 | #223 | Tragic 17.8% |
| Osage | 3.1 /100 | #224 | Tragic 17.9% |
| Immigrants | Nonimmigrants | 2.7 /100 | #225 | Tragic 17.9% |
| Bermudans | 2.6 /100 | #226 | Tragic 18.0% |
Demographics Similar to Lebanese by Child Poverty Under the Age of 16
In terms of child poverty under the age of 16, the demographic groups most similar to Lebanese are Scotch-Irish (16.3%, a difference of 0.15%), Ethiopian (16.3%, a difference of 0.30%), Immigrants from Ethiopia (16.4%, a difference of 0.43%), Immigrants from Syria (16.4%, a difference of 0.43%), and South American Indian (16.4%, a difference of 0.49%).
| Demographics | Rating | Rank | Child Poverty Under the Age of 16 |
| Uruguayans | 54.7 /100 | #169 | Average 16.1% |
| Immigrants | Colombia | 54.4 /100 | #170 | Average 16.1% |
| Hungarians | 52.5 /100 | #171 | Average 16.2% |
| Afghans | 52.3 /100 | #172 | Average 16.2% |
| Immigrants | Saudi Arabia | 52.1 /100 | #173 | Average 16.2% |
| Whites/Caucasians | 50.0 /100 | #174 | Average 16.2% |
| Scotch-Irish | 47.1 /100 | #175 | Average 16.3% |
| Lebanese | 45.9 /100 | #176 | Average 16.3% |
| Ethiopians | 43.4 /100 | #177 | Average 16.3% |
| Immigrants | Ethiopia | 42.3 /100 | #178 | Average 16.4% |
| Immigrants | Syria | 42.3 /100 | #179 | Average 16.4% |
| South American Indians | 41.8 /100 | #180 | Average 16.4% |
| Immigrants | South America | 40.8 /100 | #181 | Average 16.4% |
| Hawaiians | 38.2 /100 | #182 | Fair 16.4% |
| Celtics | 38.2 /100 | #183 | Fair 16.4% |