Japanese vs Celtic Female Poverty Among 25-34 Year Olds
COMPARE
Japanese
Celtic
Female Poverty Among 25-34 Year Olds
Female Poverty Among 25-34 Year Olds Comparison
Japanese
Celtics
14.1%
FEMALE POVERTY AMONG 25-34 YEAR OLDS
11.7/ 100
METRIC RATING
207th/ 347
METRIC RANK
14.5%
FEMALE POVERTY AMONG 25-34 YEAR OLDS
2.8/ 100
METRIC RATING
227th/ 347
METRIC RANK
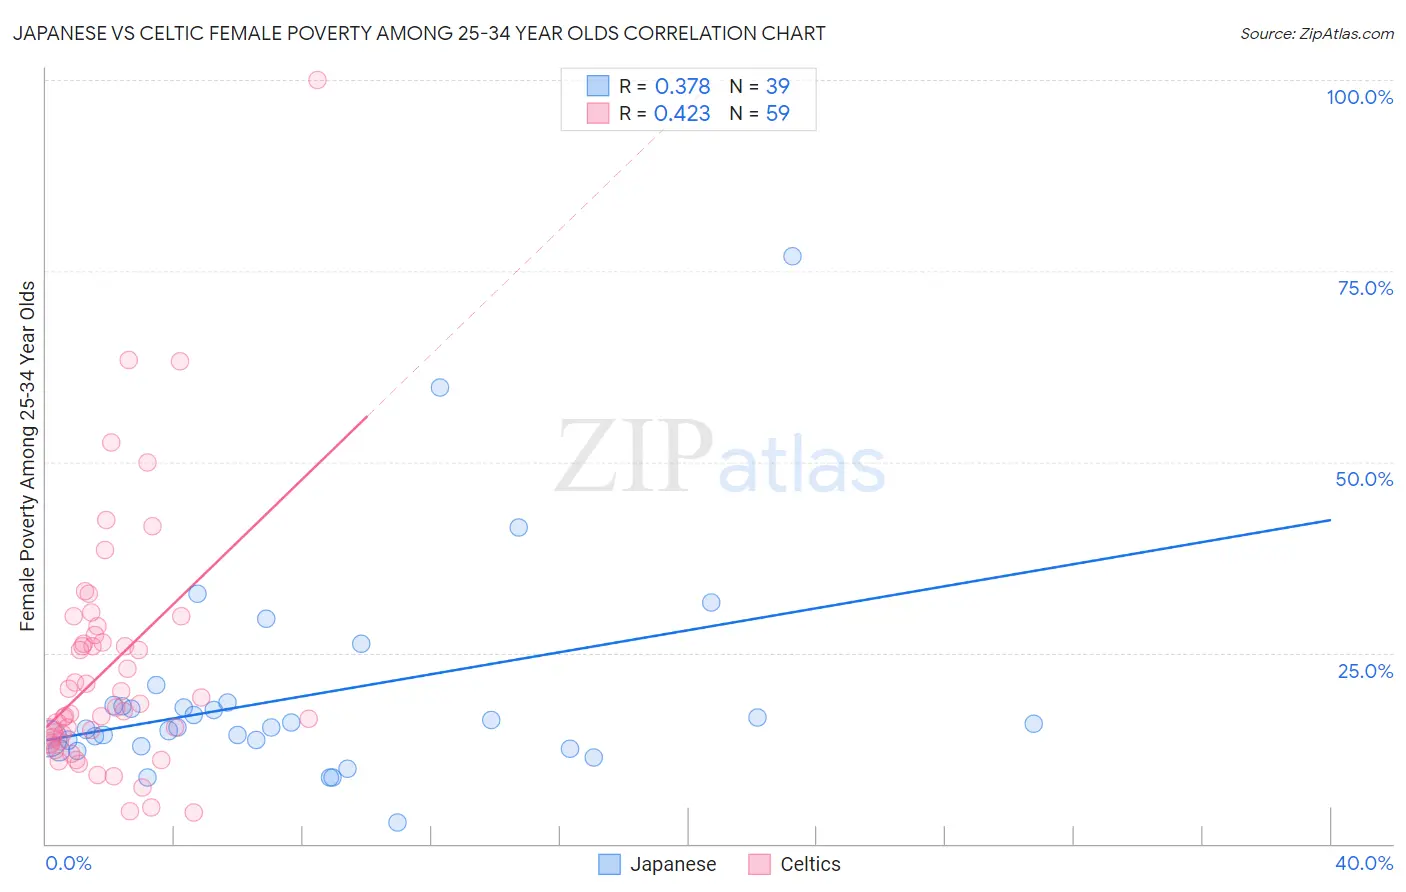
Japanese vs Celtic Female Poverty Among 25-34 Year Olds Correlation Chart
The statistical analysis conducted on geographies consisting of 247,459,659 people shows a mild positive correlation between the proportion of Japanese and poverty level among females between the ages 25 and 34 in the United States with a correlation coefficient (R) of 0.378 and weighted average of 14.1%. Similarly, the statistical analysis conducted on geographies consisting of 167,503,156 people shows a moderate positive correlation between the proportion of Celtics and poverty level among females between the ages 25 and 34 in the United States with a correlation coefficient (R) of 0.423 and weighted average of 14.5%, a difference of 3.0%.
Female Poverty Among 25-34 Year Olds Correlation Summary
| Measurement | Japanese | Celtic |
| Minimum | 2.8% | 4.1% |
| Maximum | 76.9% | 100.0% |
| Range | 74.1% | 95.9% |
| Mean | 19.3% | 23.2% |
| Median | 15.3% | 17.8% |
| Interquartile 25% (IQ1) | 12.8% | 13.4% |
| Interquartile 75% (IQ3) | 18.1% | 27.3% |
| Interquartile Range (IQR) | 5.3% | 13.9% |
| Standard Deviation (Sample) | 13.8% | 16.5% |
| Standard Deviation (Population) | 13.6% | 16.4% |
Demographics Similar to Japanese and Celtics by Female Poverty Among 25-34 Year Olds
In terms of female poverty among 25-34 year olds, the demographic groups most similar to Japanese are Immigrants from Panama (14.1%, a difference of 0.020%), Guyanese (14.2%, a difference of 0.68%), Panamanian (14.2%, a difference of 0.68%), Trinidadian and Tobagonian (14.2%, a difference of 0.80%), and Immigrants from Guyana (14.3%, a difference of 1.3%). Similarly, the demographic groups most similar to Celtics are Nicaraguan (14.5%, a difference of 0.30%), Immigrants from Barbados (14.5%, a difference of 0.38%), Immigrants from Sudan (14.4%, a difference of 0.71%), Nigerian (14.4%, a difference of 0.77%), and Immigrants from Portugal (14.4%, a difference of 0.84%).
| Demographics | Rating | Rank | Female Poverty Among 25-34 Year Olds |
| Japanese | 11.7 /100 | #207 | Poor 14.1% |
| Immigrants | Panama | 11.6 /100 | #208 | Poor 14.1% |
| Guyanese | 8.6 /100 | #209 | Tragic 14.2% |
| Panamanians | 8.6 /100 | #210 | Tragic 14.2% |
| Trinidadians and Tobagonians | 8.2 /100 | #211 | Tragic 14.2% |
| Immigrants | Guyana | 6.6 /100 | #212 | Tragic 14.3% |
| Puget Sound Salish | 6.5 /100 | #213 | Tragic 14.3% |
| French | 6.2 /100 | #214 | Tragic 14.3% |
| Immigrants | Nigeria | 6.2 /100 | #215 | Tragic 14.3% |
| French Canadians | 5.5 /100 | #216 | Tragic 14.3% |
| Spanish American Indians | 5.5 /100 | #217 | Tragic 14.3% |
| Immigrants | Thailand | 5.2 /100 | #218 | Tragic 14.3% |
| Ecuadorians | 5.2 /100 | #219 | Tragic 14.3% |
| Ghanaians | 4.8 /100 | #220 | Tragic 14.4% |
| Sudanese | 4.4 /100 | #221 | Tragic 14.4% |
| Immigrants | Portugal | 4.3 /100 | #222 | Tragic 14.4% |
| Nigerians | 4.2 /100 | #223 | Tragic 14.4% |
| Immigrants | Sudan | 4.0 /100 | #224 | Tragic 14.4% |
| Immigrants | Barbados | 3.4 /100 | #225 | Tragic 14.5% |
| Nicaraguans | 3.3 /100 | #226 | Tragic 14.5% |
| Celtics | 2.8 /100 | #227 | Tragic 14.5% |