Italian vs Immigrants from Brazil Seniors Poverty Over the Age of 75
COMPARE
Italian
Immigrants from Brazil
Seniors Poverty Over the Age of 75
Seniors Poverty Over the Age of 75 Comparison
Italians
Immigrants from Brazil
10.8%
SENIORS POVERTY OVER THE AGE OF 75
99.7/ 100
METRIC RATING
34th/ 347
METRIC RANK
12.9%
SENIORS POVERTY OVER THE AGE OF 75
5.2/ 100
METRIC RATING
216th/ 347
METRIC RANK
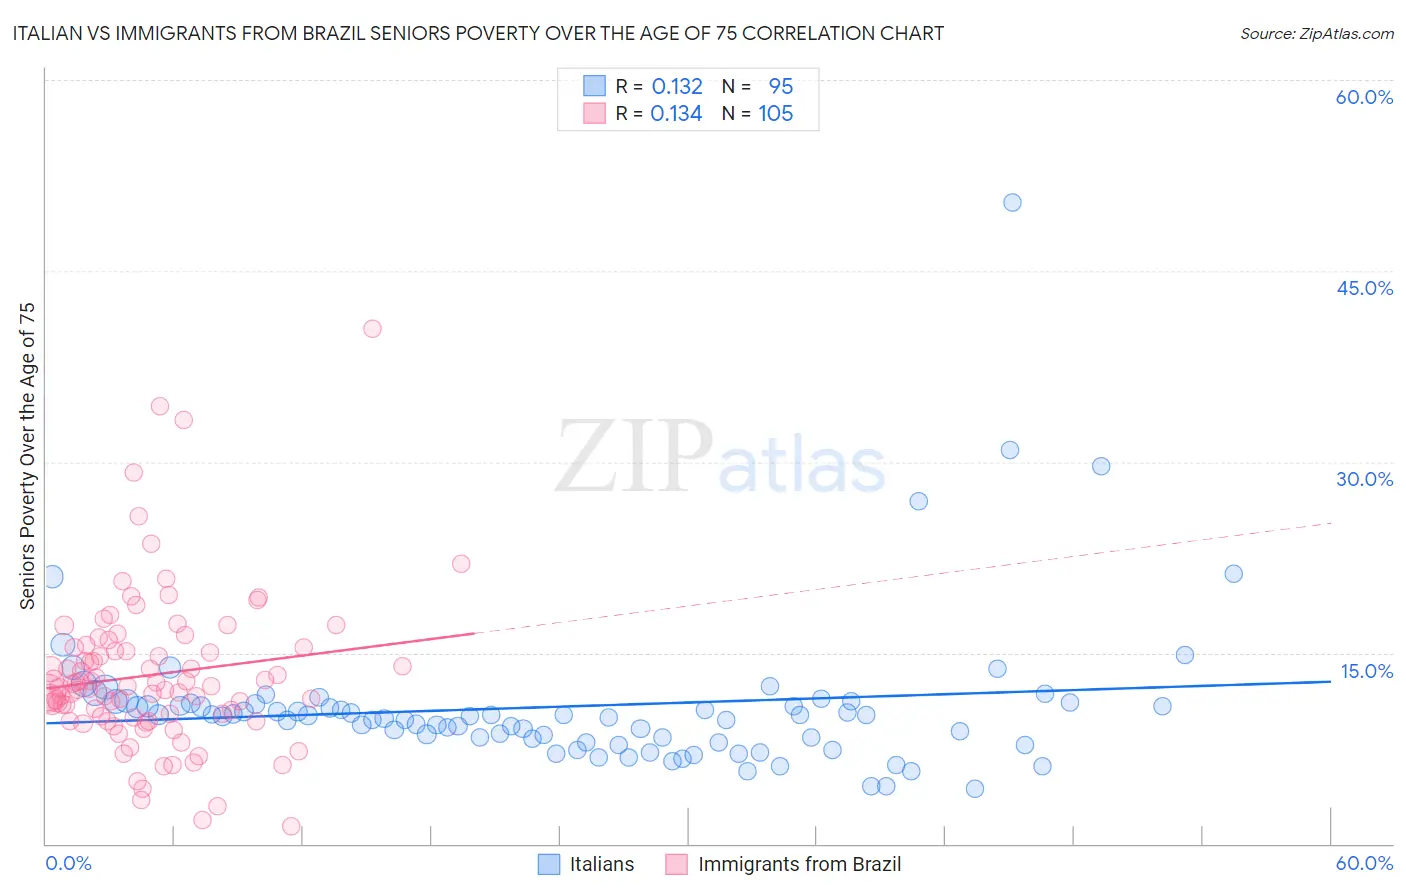
Italian vs Immigrants from Brazil Seniors Poverty Over the Age of 75 Correlation Chart
The statistical analysis conducted on geographies consisting of 557,339,767 people shows a poor positive correlation between the proportion of Italians and poverty level among seniors over the age of 75 in the United States with a correlation coefficient (R) of 0.132 and weighted average of 10.8%. Similarly, the statistical analysis conducted on geographies consisting of 339,635,702 people shows a poor positive correlation between the proportion of Immigrants from Brazil and poverty level among seniors over the age of 75 in the United States with a correlation coefficient (R) of 0.134 and weighted average of 12.9%, a difference of 20.0%.
Seniors Poverty Over the Age of 75 Correlation Summary
| Measurement | Italian | Immigrants from Brazil |
| Minimum | 4.3% | 1.4% |
| Maximum | 50.4% | 40.4% |
| Range | 46.0% | 39.1% |
| Mean | 10.8% | 13.3% |
| Median | 10.0% | 12.3% |
| Interquartile 25% (IQ1) | 8.3% | 10.0% |
| Interquartile 75% (IQ3) | 11.0% | 15.4% |
| Interquartile Range (IQR) | 2.8% | 5.5% |
| Standard Deviation (Sample) | 6.0% | 6.1% |
| Standard Deviation (Population) | 6.0% | 6.1% |
Similar Demographics by Seniors Poverty Over the Age of 75
Demographics Similar to Italians by Seniors Poverty Over the Age of 75
In terms of seniors poverty over the age of 75, the demographic groups most similar to Italians are Puget Sound Salish (10.8%, a difference of 0.050%), British (10.7%, a difference of 0.11%), Marshallese (10.7%, a difference of 0.25%), Luxembourger (10.8%, a difference of 0.38%), and Swiss (10.7%, a difference of 0.43%).
| Demographics | Rating | Rank | Seniors Poverty Over the Age of 75 |
| Northern Europeans | 99.8 /100 | #27 | Exceptional 10.7% |
| Irish | 99.8 /100 | #28 | Exceptional 10.7% |
| Assyrians/Chaldeans/Syriacs | 99.8 /100 | #29 | Exceptional 10.7% |
| Swiss | 99.7 /100 | #30 | Exceptional 10.7% |
| Marshallese | 99.7 /100 | #31 | Exceptional 10.7% |
| British | 99.7 /100 | #32 | Exceptional 10.7% |
| Puget Sound Salish | 99.7 /100 | #33 | Exceptional 10.8% |
| Italians | 99.7 /100 | #34 | Exceptional 10.8% |
| Luxembourgers | 99.6 /100 | #35 | Exceptional 10.8% |
| Scotch-Irish | 99.6 /100 | #36 | Exceptional 10.8% |
| Latvians | 99.6 /100 | #37 | Exceptional 10.8% |
| Finns | 99.6 /100 | #38 | Exceptional 10.8% |
| Czechoslovakians | 99.4 /100 | #39 | Exceptional 10.9% |
| Thais | 99.4 /100 | #40 | Exceptional 10.9% |
| Immigrants | Lithuania | 99.2 /100 | #41 | Exceptional 11.0% |
Demographics Similar to Immigrants from Brazil by Seniors Poverty Over the Age of 75
In terms of seniors poverty over the age of 75, the demographic groups most similar to Immigrants from Brazil are Bermudan (12.9%, a difference of 0.10%), South American Indian (12.9%, a difference of 0.12%), Immigrants from Western Asia (12.9%, a difference of 0.12%), Ute (12.9%, a difference of 0.18%), and Immigrants from Africa (12.9%, a difference of 0.26%).
| Demographics | Rating | Rank | Seniors Poverty Over the Age of 75 |
| Immigrants | Liberia | 7.3 /100 | #209 | Tragic 12.8% |
| Comanche | 7.0 /100 | #210 | Tragic 12.8% |
| Brazilians | 6.9 /100 | #211 | Tragic 12.8% |
| Immigrants | Hong Kong | 6.5 /100 | #212 | Tragic 12.8% |
| French American Indians | 6.1 /100 | #213 | Tragic 12.9% |
| Immigrants | Africa | 5.9 /100 | #214 | Tragic 12.9% |
| South American Indians | 5.5 /100 | #215 | Tragic 12.9% |
| Immigrants | Brazil | 5.2 /100 | #216 | Tragic 12.9% |
| Bermudans | 4.9 /100 | #217 | Tragic 12.9% |
| Immigrants | Western Asia | 4.9 /100 | #218 | Tragic 12.9% |
| Ute | 4.7 /100 | #219 | Tragic 12.9% |
| Seminole | 4.5 /100 | #220 | Tragic 12.9% |
| Immigrants | Kazakhstan | 4.3 /100 | #221 | Tragic 13.0% |
| Nigerians | 3.4 /100 | #222 | Tragic 13.0% |
| Immigrants | Nigeria | 3.3 /100 | #223 | Tragic 13.0% |