Israeli vs Immigrants from Uzbekistan Family Poverty
COMPARE
Israeli
Immigrants from Uzbekistan
Family Poverty
Family Poverty Comparison
Israelis
Immigrants from Uzbekistan
8.9%
FAMILY POVERTY
62.1/ 100
METRIC RATING
168th/ 347
METRIC RANK
10.0%
FAMILY POVERTY
3.1/ 100
METRIC RATING
229th/ 347
METRIC RANK
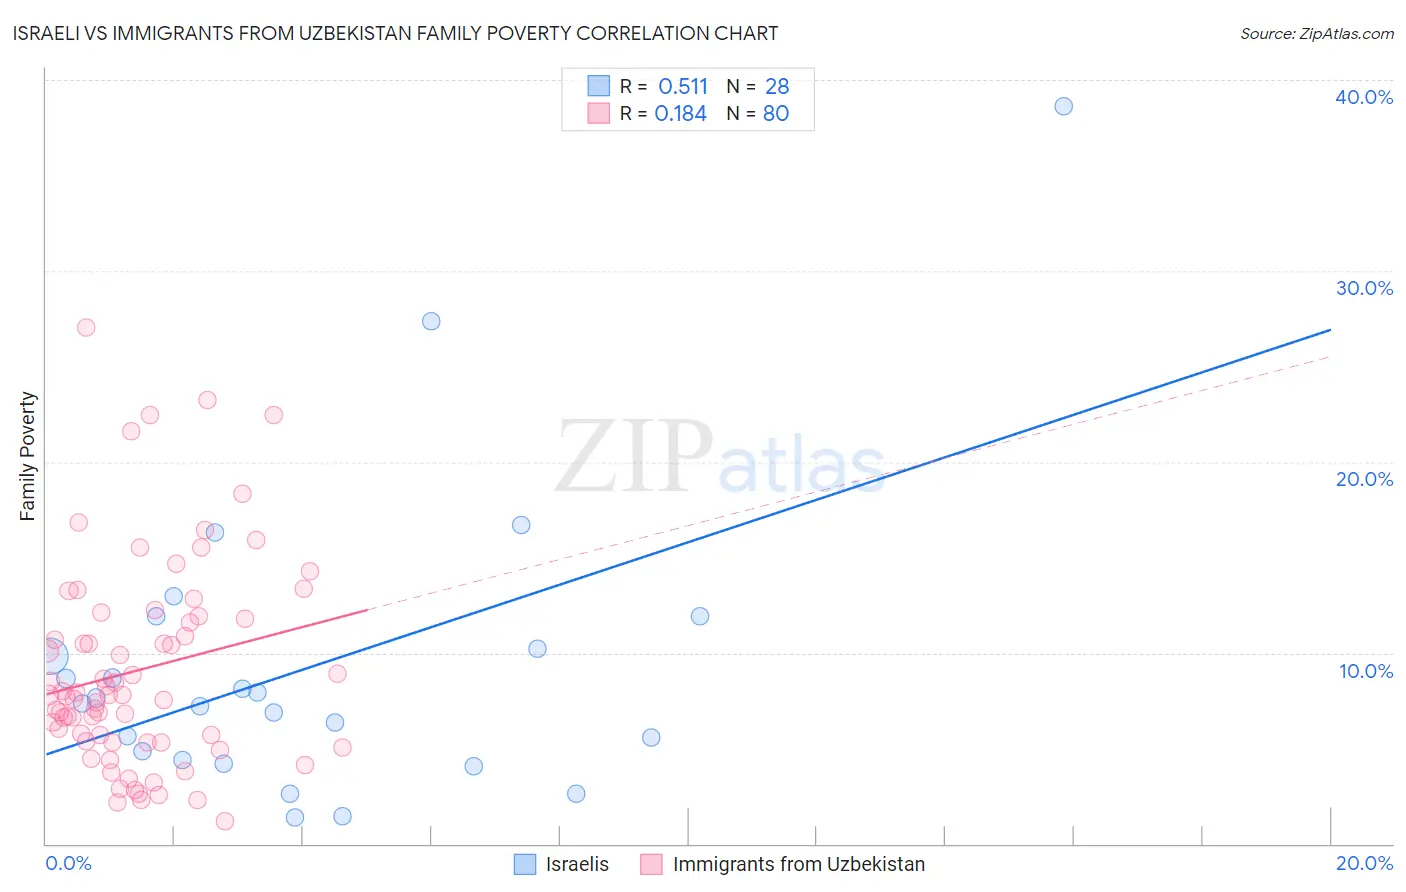
Israeli vs Immigrants from Uzbekistan Family Poverty Correlation Chart
The statistical analysis conducted on geographies consisting of 210,674,574 people shows a substantial positive correlation between the proportion of Israelis and poverty level among families in the United States with a correlation coefficient (R) of 0.511 and weighted average of 8.9%. Similarly, the statistical analysis conducted on geographies consisting of 118,666,742 people shows a poor positive correlation between the proportion of Immigrants from Uzbekistan and poverty level among families in the United States with a correlation coefficient (R) of 0.184 and weighted average of 10.0%, a difference of 13.1%.
Family Poverty Correlation Summary
| Measurement | Israeli | Immigrants from Uzbekistan |
| Minimum | 1.4% | 1.2% |
| Maximum | 38.6% | 27.0% |
| Range | 37.2% | 25.8% |
| Mean | 9.3% | 9.1% |
| Median | 7.5% | 7.8% |
| Interquartile 25% (IQ1) | 4.6% | 5.3% |
| Interquartile 75% (IQ3) | 11.0% | 11.9% |
| Interquartile Range (IQR) | 6.4% | 6.5% |
| Standard Deviation (Sample) | 7.9% | 5.4% |
| Standard Deviation (Population) | 7.8% | 5.4% |
Similar Demographics by Family Poverty
Demographics Similar to Israelis by Family Poverty
In terms of family poverty, the demographic groups most similar to Israelis are Immigrants from Ethiopia (8.9%, a difference of 0.060%), Afghan (8.8%, a difference of 0.20%), Immigrants from Chile (8.9%, a difference of 0.35%), Guamanian/Chamorro (8.8%, a difference of 0.38%), and Celtic (8.8%, a difference of 0.41%).
| Demographics | Rating | Rank | Family Poverty |
| Immigrants | Northern Africa | 66.9 /100 | #161 | Good 8.8% |
| Ethiopians | 66.3 /100 | #162 | Good 8.8% |
| Pennsylvania Germans | 66.0 /100 | #163 | Good 8.8% |
| Celtics | 64.9 /100 | #164 | Good 8.8% |
| Guamanians/Chamorros | 64.7 /100 | #165 | Good 8.8% |
| Afghans | 63.5 /100 | #166 | Good 8.8% |
| Immigrants | Ethiopia | 62.5 /100 | #167 | Good 8.9% |
| Israelis | 62.1 /100 | #168 | Good 8.9% |
| Immigrants | Chile | 59.6 /100 | #169 | Average 8.9% |
| Kenyans | 58.2 /100 | #170 | Average 8.9% |
| Lebanese | 57.6 /100 | #171 | Average 8.9% |
| Immigrants | Peru | 57.5 /100 | #172 | Average 8.9% |
| Immigrants | Fiji | 56.4 /100 | #173 | Average 8.9% |
| Immigrants | Albania | 50.0 /100 | #174 | Average 9.0% |
| Costa Ricans | 49.3 /100 | #175 | Average 9.0% |
Demographics Similar to Immigrants from Uzbekistan by Family Poverty
In terms of family poverty, the demographic groups most similar to Immigrants from Uzbekistan are Sudanese (10.0%, a difference of 0.010%), Immigrants from Panama (10.0%, a difference of 0.020%), Immigrants from Armenia (10.0%, a difference of 0.21%), Ottawa (10.0%, a difference of 0.23%), and Alaskan Athabascan (10.1%, a difference of 0.40%).
| Demographics | Rating | Rank | Family Poverty |
| Japanese | 4.8 /100 | #222 | Tragic 9.9% |
| Immigrants | Africa | 4.3 /100 | #223 | Tragic 9.9% |
| Marshallese | 3.9 /100 | #224 | Tragic 9.9% |
| Immigrants | Immigrants | 3.6 /100 | #225 | Tragic 10.0% |
| Ottawa | 3.3 /100 | #226 | Tragic 10.0% |
| Immigrants | Armenia | 3.3 /100 | #227 | Tragic 10.0% |
| Sudanese | 3.1 /100 | #228 | Tragic 10.0% |
| Immigrants | Uzbekistan | 3.1 /100 | #229 | Tragic 10.0% |
| Immigrants | Panama | 3.1 /100 | #230 | Tragic 10.0% |
| Alaskan Athabascans | 2.7 /100 | #231 | Tragic 10.1% |
| Immigrants | Sudan | 2.3 /100 | #232 | Tragic 10.1% |
| Fijians | 2.1 /100 | #233 | Tragic 10.1% |
| Immigrants | Middle Africa | 2.1 /100 | #234 | Tragic 10.1% |
| Nigerians | 2.0 /100 | #235 | Tragic 10.1% |
| Immigrants | Nigeria | 1.9 /100 | #236 | Tragic 10.2% |