Immigrants from Saudi Arabia vs Ukrainian Child Poverty Under the Age of 16
COMPARE
Immigrants from Saudi Arabia
Ukrainian
Child Poverty Under the Age of 16
Child Poverty Under the Age of 16 Comparison
Immigrants from Saudi Arabia
Ukrainians
16.2%
CHILD POVERTY UNDER THE AGE OF 16
52.1/ 100
METRIC RATING
173rd/ 347
METRIC RANK
14.4%
CHILD POVERTY UNDER THE AGE OF 16
97.5/ 100
METRIC RATING
75th/ 347
METRIC RANK
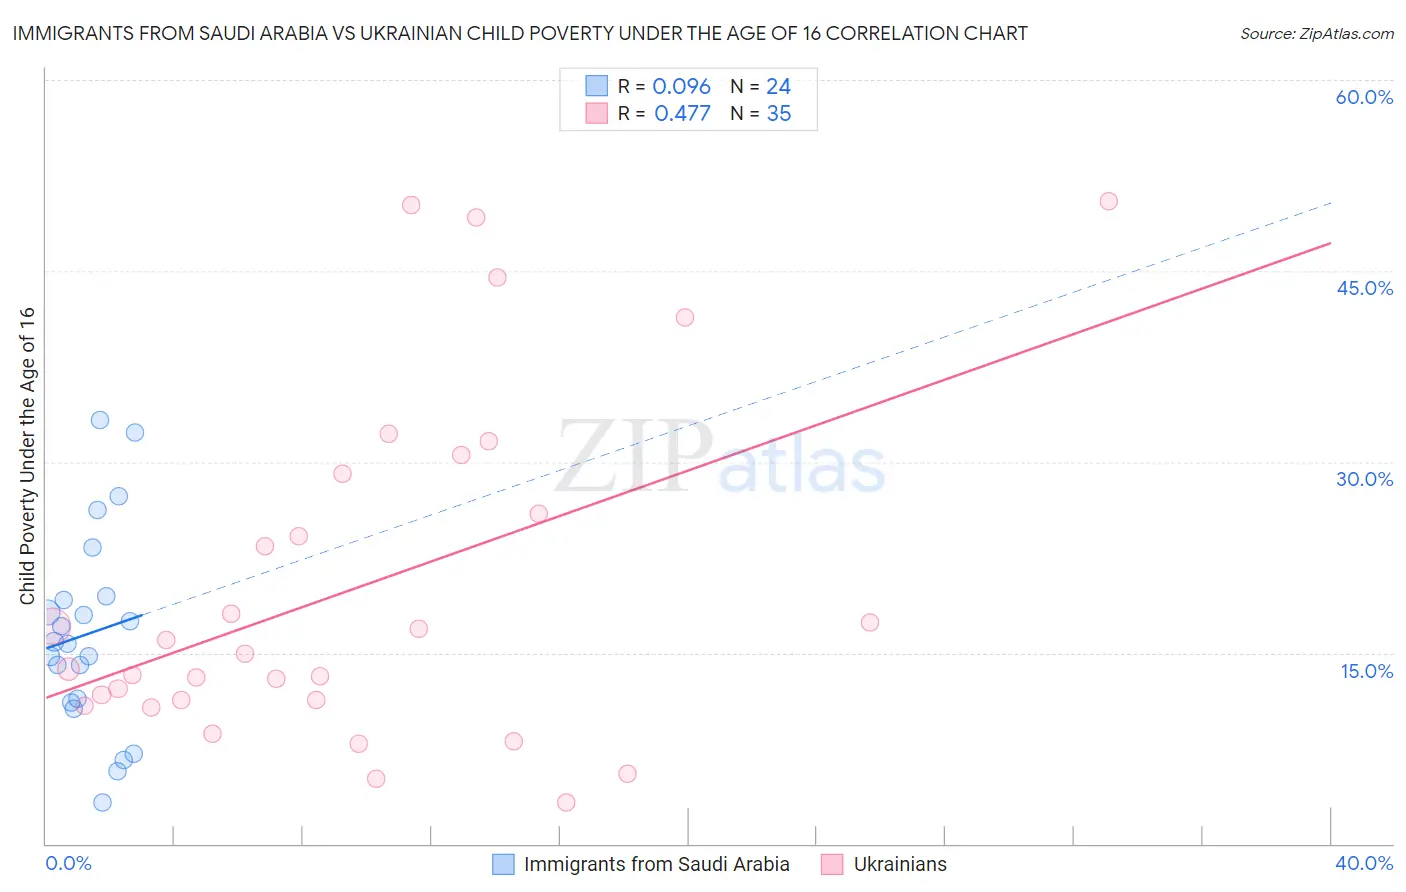
Immigrants from Saudi Arabia vs Ukrainian Child Poverty Under the Age of 16 Correlation Chart
The statistical analysis conducted on geographies consisting of 163,849,520 people shows a slight positive correlation between the proportion of Immigrants from Saudi Arabia and poverty level among children under the age of 16 in the United States with a correlation coefficient (R) of 0.096 and weighted average of 16.2%. Similarly, the statistical analysis conducted on geographies consisting of 441,775,506 people shows a moderate positive correlation between the proportion of Ukrainians and poverty level among children under the age of 16 in the United States with a correlation coefficient (R) of 0.477 and weighted average of 14.4%, a difference of 12.0%.
Child Poverty Under the Age of 16 Correlation Summary
| Measurement | Immigrants from Saudi Arabia | Ukrainian |
| Minimum | 3.3% | 3.2% |
| Maximum | 33.3% | 50.5% |
| Range | 30.1% | 47.2% |
| Mean | 16.5% | 20.2% |
| Median | 15.8% | 14.9% |
| Interquartile 25% (IQ1) | 11.2% | 11.3% |
| Interquartile 75% (IQ3) | 19.3% | 29.0% |
| Interquartile Range (IQR) | 8.1% | 17.8% |
| Standard Deviation (Sample) | 7.8% | 13.5% |
| Standard Deviation (Population) | 7.6% | 13.3% |
Similar Demographics by Child Poverty Under the Age of 16
Demographics Similar to Immigrants from Saudi Arabia by Child Poverty Under the Age of 16
In terms of child poverty under the age of 16, the demographic groups most similar to Immigrants from Saudi Arabia are Afghan (16.2%, a difference of 0.020%), Hungarian (16.2%, a difference of 0.050%), White/Caucasian (16.2%, a difference of 0.25%), Immigrants from Colombia (16.1%, a difference of 0.28%), and Uruguayan (16.1%, a difference of 0.31%).
| Demographics | Rating | Rank | Child Poverty Under the Age of 16 |
| Immigrants | Oceania | 65.4 /100 | #166 | Good 15.9% |
| Costa Ricans | 61.1 /100 | #167 | Good 16.0% |
| South Americans | 57.9 /100 | #168 | Average 16.0% |
| Uruguayans | 54.7 /100 | #169 | Average 16.1% |
| Immigrants | Colombia | 54.4 /100 | #170 | Average 16.1% |
| Hungarians | 52.5 /100 | #171 | Average 16.2% |
| Afghans | 52.3 /100 | #172 | Average 16.2% |
| Immigrants | Saudi Arabia | 52.1 /100 | #173 | Average 16.2% |
| Whites/Caucasians | 50.0 /100 | #174 | Average 16.2% |
| Scotch-Irish | 47.1 /100 | #175 | Average 16.3% |
| Lebanese | 45.9 /100 | #176 | Average 16.3% |
| Ethiopians | 43.4 /100 | #177 | Average 16.3% |
| Immigrants | Ethiopia | 42.3 /100 | #178 | Average 16.4% |
| Immigrants | Syria | 42.3 /100 | #179 | Average 16.4% |
| South American Indians | 41.8 /100 | #180 | Average 16.4% |
Demographics Similar to Ukrainians by Child Poverty Under the Age of 16
In terms of child poverty under the age of 16, the demographic groups most similar to Ukrainians are Immigrants from Eastern Europe (14.4%, a difference of 0.0%), Australian (14.4%, a difference of 0.040%), Macedonian (14.4%, a difference of 0.20%), Immigrants from Turkey (14.4%, a difference of 0.21%), and Immigrants from Russia (14.5%, a difference of 0.23%).
| Demographics | Rating | Rank | Child Poverty Under the Age of 16 |
| Laotians | 98.0 /100 | #68 | Exceptional 14.3% |
| Immigrants | Bulgaria | 98.0 /100 | #69 | Exceptional 14.3% |
| Immigrants | Netherlands | 97.9 /100 | #70 | Exceptional 14.3% |
| Immigrants | Poland | 97.9 /100 | #71 | Exceptional 14.3% |
| Cambodians | 97.8 /100 | #72 | Exceptional 14.4% |
| Immigrants | Turkey | 97.6 /100 | #73 | Exceptional 14.4% |
| Macedonians | 97.6 /100 | #74 | Exceptional 14.4% |
| Ukrainians | 97.5 /100 | #75 | Exceptional 14.4% |
| Immigrants | Eastern Europe | 97.5 /100 | #76 | Exceptional 14.4% |
| Australians | 97.5 /100 | #77 | Exceptional 14.4% |
| Immigrants | Russia | 97.3 /100 | #78 | Exceptional 14.5% |
| Swiss | 97.3 /100 | #79 | Exceptional 14.5% |
| Immigrants | North Macedonia | 97.2 /100 | #80 | Exceptional 14.5% |
| Finns | 97.2 /100 | #81 | Exceptional 14.5% |
| Immigrants | Canada | 97.2 /100 | #82 | Exceptional 14.5% |