Irish vs Immigrants from Italy Child Poverty Under the Age of 16
COMPARE
Irish
Immigrants from Italy
Child Poverty Under the Age of 16
Child Poverty Under the Age of 16 Comparison
Irish
Immigrants from Italy
14.9%
CHILD POVERTY UNDER THE AGE OF 16
93.4/ 100
METRIC RATING
112th/ 347
METRIC RANK
14.6%
CHILD POVERTY UNDER THE AGE OF 16
96.7/ 100
METRIC RATING
92nd/ 347
METRIC RANK
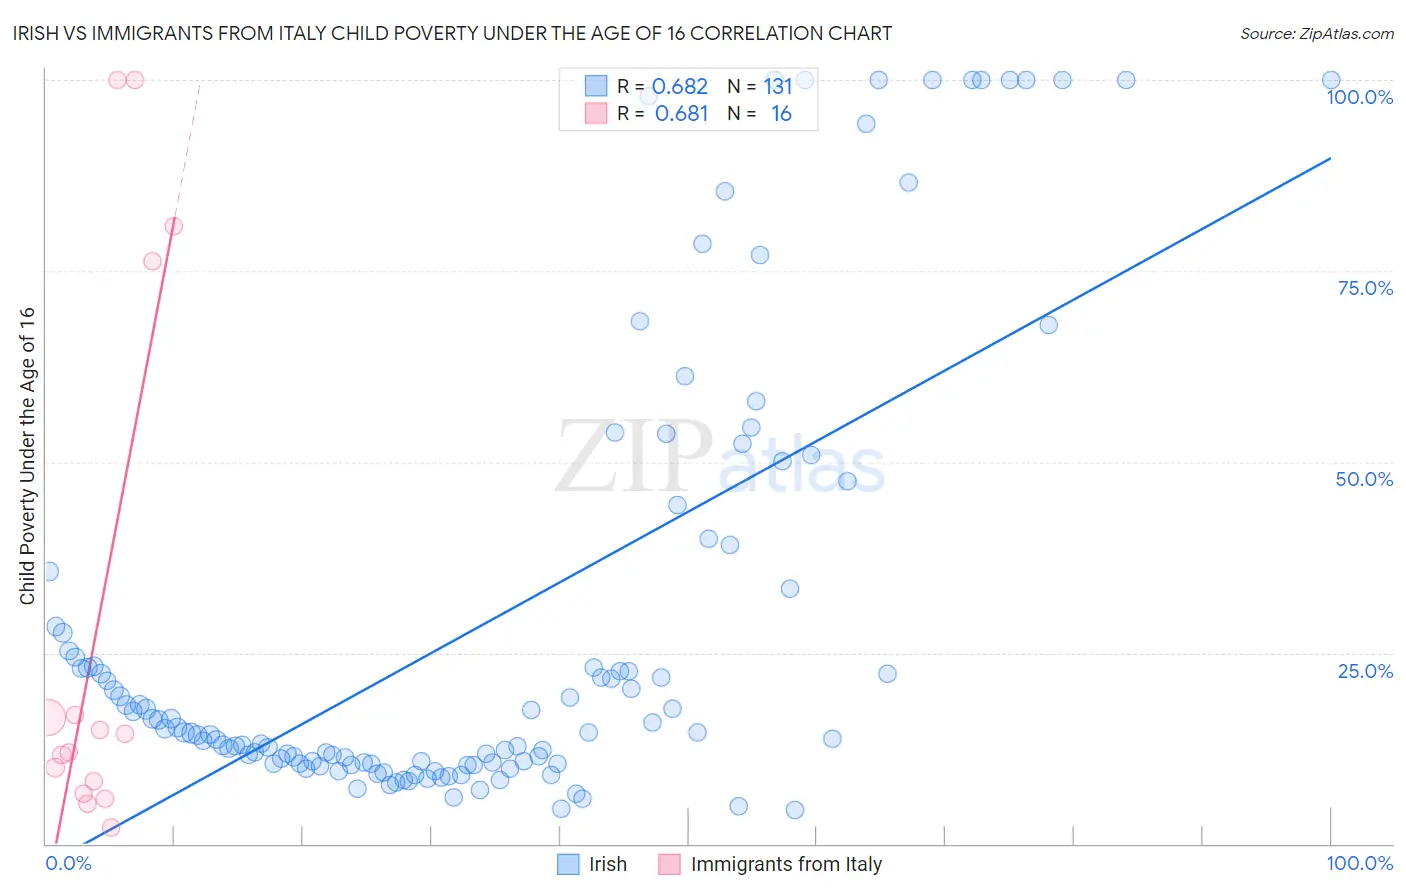
Irish vs Immigrants from Italy Child Poverty Under the Age of 16 Correlation Chart
The statistical analysis conducted on geographies consisting of 565,748,670 people shows a significant positive correlation between the proportion of Irish and poverty level among children under the age of 16 in the United States with a correlation coefficient (R) of 0.682 and weighted average of 14.9%. Similarly, the statistical analysis conducted on geographies consisting of 320,629,971 people shows a significant positive correlation between the proportion of Immigrants from Italy and poverty level among children under the age of 16 in the United States with a correlation coefficient (R) of 0.681 and weighted average of 14.6%, a difference of 2.4%.
Child Poverty Under the Age of 16 Correlation Summary
| Measurement | Irish | Immigrants from Italy |
| Minimum | 4.5% | 2.2% |
| Maximum | 100.0% | 100.0% |
| Range | 95.5% | 97.8% |
| Mean | 28.8% | 30.1% |
| Median | 14.6% | 13.2% |
| Interquartile 25% (IQ1) | 10.6% | 7.3% |
| Interquartile 75% (IQ3) | 33.4% | 46.5% |
| Interquartile Range (IQR) | 22.9% | 39.2% |
| Standard Deviation (Sample) | 29.2% | 36.0% |
| Standard Deviation (Population) | 29.1% | 34.8% |
Demographics Similar to Irish and Immigrants from Italy by Child Poverty Under the Age of 16
In terms of child poverty under the age of 16, the demographic groups most similar to Irish are Immigrants from Denmark (14.9%, a difference of 0.060%), English (14.9%, a difference of 0.070%), Tlingit-Haida (14.9%, a difference of 0.41%), Jordanian (14.8%, a difference of 0.48%), and Chilean (14.8%, a difference of 0.57%). Similarly, the demographic groups most similar to Immigrants from Italy are Argentinean (14.6%, a difference of 0.090%), Immigrants from South Africa (14.6%, a difference of 0.37%), Immigrants from Croatia (14.6%, a difference of 0.54%), Immigrants from France (14.7%, a difference of 0.79%), and Paraguayan (14.7%, a difference of 0.90%).
| Demographics | Rating | Rank | Child Poverty Under the Age of 16 |
| Immigrants | Italy | 96.7 /100 | #92 | Exceptional 14.6% |
| Argentineans | 96.6 /100 | #93 | Exceptional 14.6% |
| Immigrants | South Africa | 96.3 /100 | #94 | Exceptional 14.6% |
| Immigrants | Croatia | 96.1 /100 | #95 | Exceptional 14.6% |
| Immigrants | France | 95.8 /100 | #96 | Exceptional 14.7% |
| Paraguayans | 95.7 /100 | #97 | Exceptional 14.7% |
| Immigrants | Belarus | 95.7 /100 | #98 | Exceptional 14.7% |
| British | 95.5 /100 | #99 | Exceptional 14.7% |
| Dutch | 95.1 /100 | #100 | Exceptional 14.8% |
| Immigrants | Switzerland | 95.1 /100 | #101 | Exceptional 14.8% |
| Romanians | 95.0 /100 | #102 | Exceptional 14.8% |
| Immigrants | Egypt | 94.9 /100 | #103 | Exceptional 14.8% |
| Immigrants | England | 94.8 /100 | #104 | Exceptional 14.8% |
| Basques | 94.7 /100 | #105 | Exceptional 14.8% |
| Serbians | 94.5 /100 | #106 | Exceptional 14.8% |
| Chileans | 94.4 /100 | #107 | Exceptional 14.8% |
| Jordanians | 94.2 /100 | #108 | Exceptional 14.8% |
| Tlingit-Haida | 94.1 /100 | #109 | Exceptional 14.9% |
| English | 93.5 /100 | #110 | Exceptional 14.9% |
| Immigrants | Denmark | 93.5 /100 | #111 | Exceptional 14.9% |
| Irish | 93.4 /100 | #112 | Exceptional 14.9% |