Inupiat vs Immigrants from Norway Seniors Poverty Over the Age of 75
COMPARE
Inupiat
Immigrants from Norway
Seniors Poverty Over the Age of 75
Seniors Poverty Over the Age of 75 Comparison
Inupiat
Immigrants from Norway
13.8%
SENIORS POVERTY OVER THE AGE OF 75
0.1/ 100
METRIC RATING
256th/ 347
METRIC RANK
12.1%
SENIORS POVERTY OVER THE AGE OF 75
60.6/ 100
METRIC RATING
161st/ 347
METRIC RANK
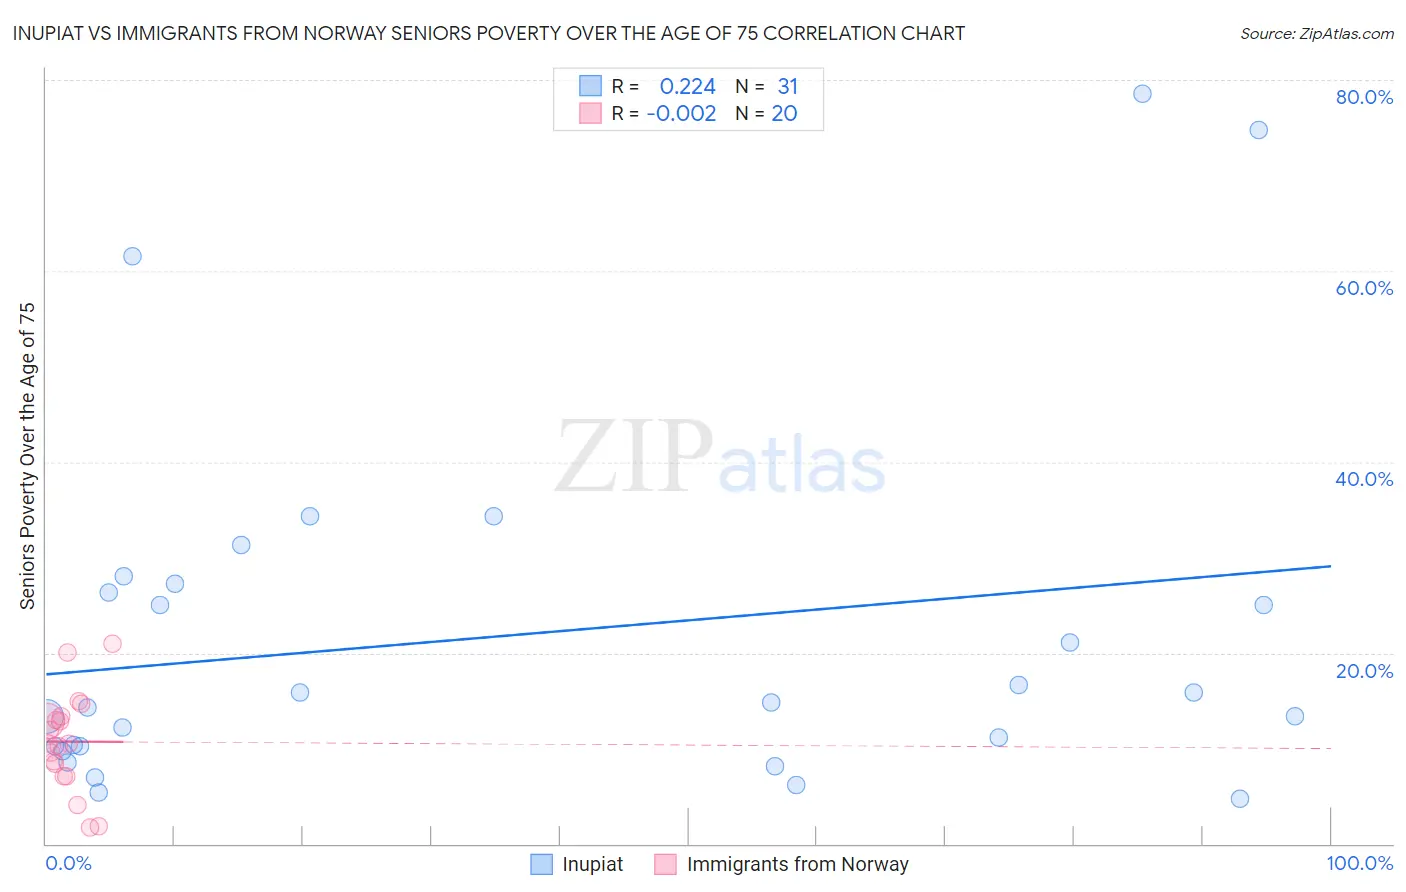
Inupiat vs Immigrants from Norway Seniors Poverty Over the Age of 75 Correlation Chart
The statistical analysis conducted on geographies consisting of 95,812,676 people shows a weak positive correlation between the proportion of Inupiat and poverty level among seniors over the age of 75 in the United States with a correlation coefficient (R) of 0.224 and weighted average of 13.8%. Similarly, the statistical analysis conducted on geographies consisting of 116,318,063 people shows no correlation between the proportion of Immigrants from Norway and poverty level among seniors over the age of 75 in the United States with a correlation coefficient (R) of -0.002 and weighted average of 12.1%, a difference of 14.5%.
Seniors Poverty Over the Age of 75 Correlation Summary
| Measurement | Inupiat | Immigrants from Norway |
| Minimum | 4.8% | 1.8% |
| Maximum | 78.6% | 21.0% |
| Range | 73.8% | 19.2% |
| Mean | 21.8% | 10.7% |
| Median | 14.8% | 10.4% |
| Interquartile 25% (IQ1) | 10.3% | 7.8% |
| Interquartile 75% (IQ3) | 27.3% | 13.1% |
| Interquartile Range (IQR) | 17.0% | 5.3% |
| Standard Deviation (Sample) | 18.8% | 5.1% |
| Standard Deviation (Population) | 18.5% | 4.9% |
Similar Demographics by Seniors Poverty Over the Age of 75
Demographics Similar to Inupiat by Seniors Poverty Over the Age of 75
In terms of seniors poverty over the age of 75, the demographic groups most similar to Inupiat are Immigrants from Belarus (13.8%, a difference of 0.50%), Immigrants from Western Africa (13.9%, a difference of 0.58%), Immigrants from Panama (13.9%, a difference of 0.67%), Immigrants from Portugal (13.9%, a difference of 0.71%), and Immigrants (13.9%, a difference of 0.78%).
| Demographics | Rating | Rank | Seniors Poverty Over the Age of 75 |
| Immigrants | Albania | 0.3 /100 | #249 | Tragic 13.6% |
| Mexican American Indians | 0.3 /100 | #250 | Tragic 13.6% |
| Immigrants | Peru | 0.3 /100 | #251 | Tragic 13.7% |
| Immigrants | Argentina | 0.3 /100 | #252 | Tragic 13.7% |
| Immigrants | Spain | 0.2 /100 | #253 | Tragic 13.7% |
| Blackfeet | 0.2 /100 | #254 | Tragic 13.7% |
| Immigrants | Belarus | 0.2 /100 | #255 | Tragic 13.8% |
| Inupiat | 0.1 /100 | #256 | Tragic 13.8% |
| Immigrants | Western Africa | 0.1 /100 | #257 | Tragic 13.9% |
| Immigrants | Panama | 0.1 /100 | #258 | Tragic 13.9% |
| Immigrants | Portugal | 0.1 /100 | #259 | Tragic 13.9% |
| Immigrants | Immigrants | 0.1 /100 | #260 | Tragic 13.9% |
| Ghanaians | 0.1 /100 | #261 | Tragic 14.0% |
| Cajuns | 0.1 /100 | #262 | Tragic 14.0% |
| Iroquois | 0.1 /100 | #263 | Tragic 14.0% |
Demographics Similar to Immigrants from Norway by Seniors Poverty Over the Age of 75
In terms of seniors poverty over the age of 75, the demographic groups most similar to Immigrants from Norway are Immigrants from Eastern Africa (12.1%, a difference of 0.020%), Immigrants from Serbia (12.1%, a difference of 0.030%), Immigrants from Middle Africa (12.1%, a difference of 0.050%), Portuguese (12.1%, a difference of 0.060%), and Immigrants from Sudan (12.1%, a difference of 0.090%).
| Demographics | Rating | Rank | Seniors Poverty Over the Age of 75 |
| Cambodians | 64.0 /100 | #154 | Good 12.0% |
| Indonesians | 62.6 /100 | #155 | Good 12.1% |
| Immigrants | Burma/Myanmar | 62.3 /100 | #156 | Good 12.1% |
| Immigrants | Sudan | 61.7 /100 | #157 | Good 12.1% |
| Portuguese | 61.3 /100 | #158 | Good 12.1% |
| Immigrants | Middle Africa | 61.2 /100 | #159 | Good 12.1% |
| Immigrants | Eastern Africa | 60.9 /100 | #160 | Good 12.1% |
| Immigrants | Norway | 60.6 /100 | #161 | Good 12.1% |
| Immigrants | Serbia | 60.2 /100 | #162 | Good 12.1% |
| Immigrants | Greece | 58.2 /100 | #163 | Average 12.1% |
| Potawatomi | 57.4 /100 | #164 | Average 12.1% |
| Okinawans | 56.3 /100 | #165 | Average 12.1% |
| Egyptians | 54.8 /100 | #166 | Average 12.1% |
| Immigrants | Switzerland | 54.5 /100 | #167 | Average 12.1% |
| Immigrants | Syria | 53.9 /100 | #168 | Average 12.2% |