Inupiat vs Barbadian Seniors Poverty Over the Age of 65
COMPARE
Inupiat
Barbadian
Seniors Poverty Over the Age of 65
Seniors Poverty Over the Age of 65 Comparison
Inupiat
Barbadians
12.6%
SENIORS POVERTY OVER THE AGE OF 65
0.1/ 100
METRIC RATING
264th/ 347
METRIC RANK
14.4%
SENIORS POVERTY OVER THE AGE OF 65
0.0/ 100
METRIC RATING
313th/ 347
METRIC RANK
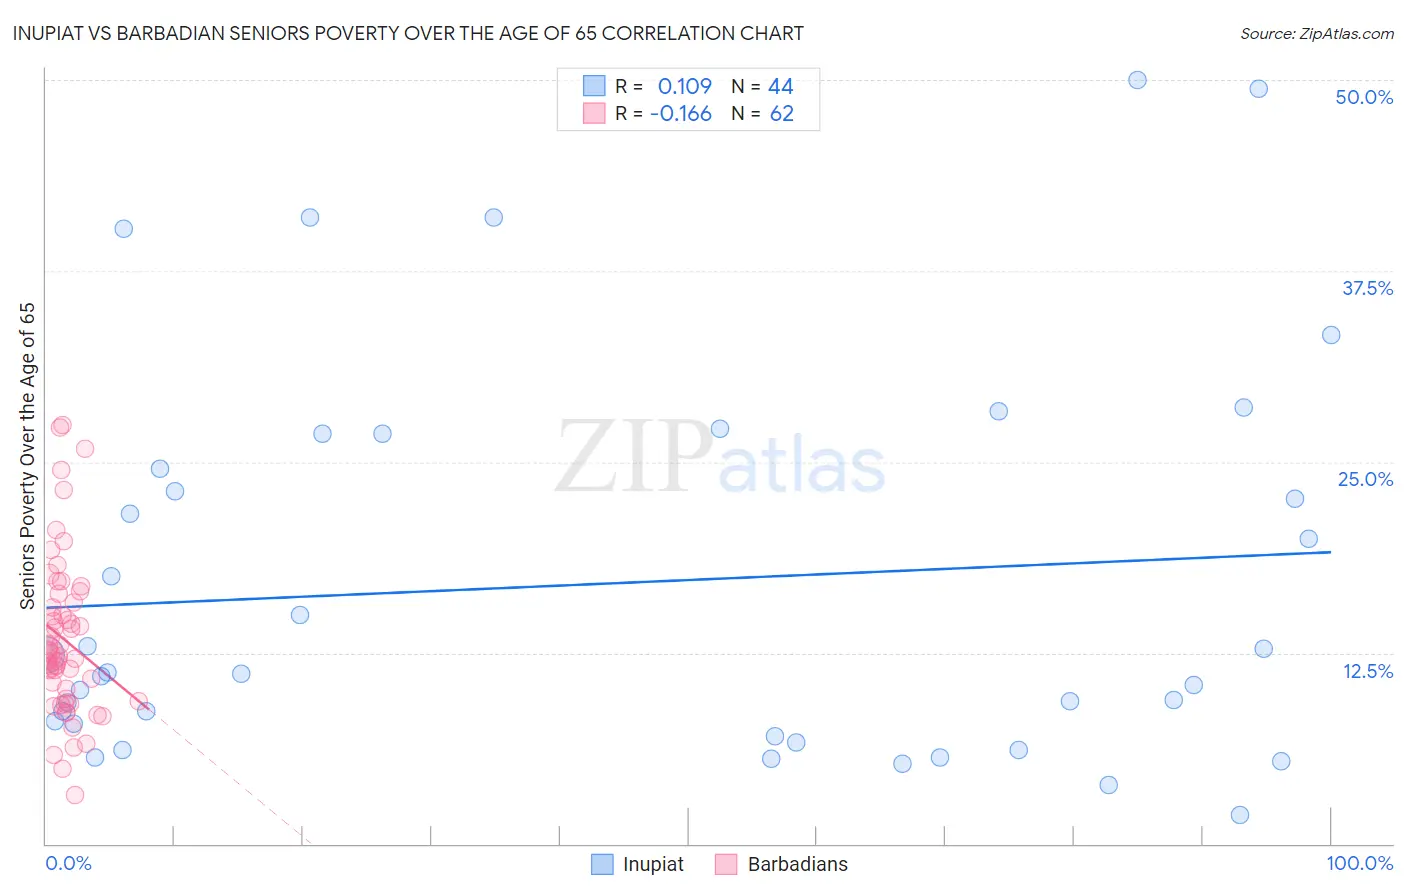
Inupiat vs Barbadian Seniors Poverty Over the Age of 65 Correlation Chart
The statistical analysis conducted on geographies consisting of 96,149,524 people shows a poor positive correlation between the proportion of Inupiat and poverty level among seniors over the age of 65 in the United States with a correlation coefficient (R) of 0.109 and weighted average of 12.6%. Similarly, the statistical analysis conducted on geographies consisting of 141,112,181 people shows a poor negative correlation between the proportion of Barbadians and poverty level among seniors over the age of 65 in the United States with a correlation coefficient (R) of -0.166 and weighted average of 14.4%, a difference of 14.4%.
Seniors Poverty Over the Age of 65 Correlation Summary
| Measurement | Inupiat | Barbadian |
| Minimum | 1.9% | 3.2% |
| Maximum | 50.0% | 27.4% |
| Range | 48.1% | 24.2% |
| Mean | 17.0% | 13.4% |
| Median | 11.2% | 12.5% |
| Interquartile 25% (IQ1) | 7.5% | 9.5% |
| Interquartile 75% (IQ3) | 25.7% | 15.8% |
| Interquartile Range (IQR) | 18.2% | 6.3% |
| Standard Deviation (Sample) | 12.8% | 5.2% |
| Standard Deviation (Population) | 12.7% | 5.1% |
Similar Demographics by Seniors Poverty Over the Age of 65
Demographics Similar to Inupiat by Seniors Poverty Over the Age of 65
In terms of seniors poverty over the age of 65, the demographic groups most similar to Inupiat are Soviet Union (12.6%, a difference of 0.070%), Immigrants from Western Africa (12.6%, a difference of 0.090%), Venezuelan (12.5%, a difference of 0.23%), African (12.6%, a difference of 0.26%), and Blackfeet (12.6%, a difference of 0.40%).
| Demographics | Rating | Rank | Seniors Poverty Over the Age of 65 |
| Immigrants | Immigrants | 0.2 /100 | #257 | Tragic 12.4% |
| Dutch West Indians | 0.2 /100 | #258 | Tragic 12.4% |
| Ghanaians | 0.2 /100 | #259 | Tragic 12.4% |
| South Americans | 0.2 /100 | #260 | Tragic 12.5% |
| Colombians | 0.2 /100 | #261 | Tragic 12.5% |
| Venezuelans | 0.1 /100 | #262 | Tragic 12.5% |
| Soviet Union | 0.1 /100 | #263 | Tragic 12.6% |
| Inupiat | 0.1 /100 | #264 | Tragic 12.6% |
| Immigrants | Western Africa | 0.1 /100 | #265 | Tragic 12.6% |
| Africans | 0.1 /100 | #266 | Tragic 12.6% |
| Blackfeet | 0.1 /100 | #267 | Tragic 12.6% |
| Immigrants | Somalia | 0.1 /100 | #268 | Tragic 12.6% |
| Immigrants | Venezuela | 0.1 /100 | #269 | Tragic 12.7% |
| Immigrants | South America | 0.1 /100 | #270 | Tragic 12.7% |
| Immigrants | Ghana | 0.1 /100 | #271 | Tragic 12.8% |
Demographics Similar to Barbadians by Seniors Poverty Over the Age of 65
In terms of seniors poverty over the age of 65, the demographic groups most similar to Barbadians are Hispanic or Latino (14.3%, a difference of 0.37%), Guyanese (14.4%, a difference of 0.39%), Immigrants from Ecuador (14.4%, a difference of 0.43%), Immigrants from Guyana (14.5%, a difference of 0.64%), and Haitian (14.5%, a difference of 0.67%).
| Demographics | Rating | Rank | Seniors Poverty Over the Age of 65 |
| Immigrants | Latin America | 0.0 /100 | #306 | Tragic 14.2% |
| Immigrants | West Indies | 0.0 /100 | #307 | Tragic 14.2% |
| Trinidadians and Tobagonians | 0.0 /100 | #308 | Tragic 14.2% |
| Hondurans | 0.0 /100 | #309 | Tragic 14.2% |
| Bahamians | 0.0 /100 | #310 | Tragic 14.2% |
| Natives/Alaskans | 0.0 /100 | #311 | Tragic 14.2% |
| Hispanics or Latinos | 0.0 /100 | #312 | Tragic 14.3% |
| Barbadians | 0.0 /100 | #313 | Tragic 14.4% |
| Guyanese | 0.0 /100 | #314 | Tragic 14.4% |
| Immigrants | Ecuador | 0.0 /100 | #315 | Tragic 14.4% |
| Immigrants | Guyana | 0.0 /100 | #316 | Tragic 14.5% |
| Haitians | 0.0 /100 | #317 | Tragic 14.5% |
| Immigrants | Honduras | 0.0 /100 | #318 | Tragic 14.5% |
| Cape Verdeans | 0.0 /100 | #319 | Tragic 14.7% |
| Immigrants | Haiti | 0.0 /100 | #320 | Tragic 14.7% |