Immigrants from Singapore vs Barbadian Seniors Poverty Over the Age of 65
COMPARE
Immigrants from Singapore
Barbadian
Seniors Poverty Over the Age of 65
Seniors Poverty Over the Age of 65 Comparison
Immigrants from Singapore
Barbadians
10.1%
SENIORS POVERTY OVER THE AGE OF 65
96.9/ 100
METRIC RATING
92nd/ 347
METRIC RANK
14.4%
SENIORS POVERTY OVER THE AGE OF 65
0.0/ 100
METRIC RATING
313th/ 347
METRIC RANK
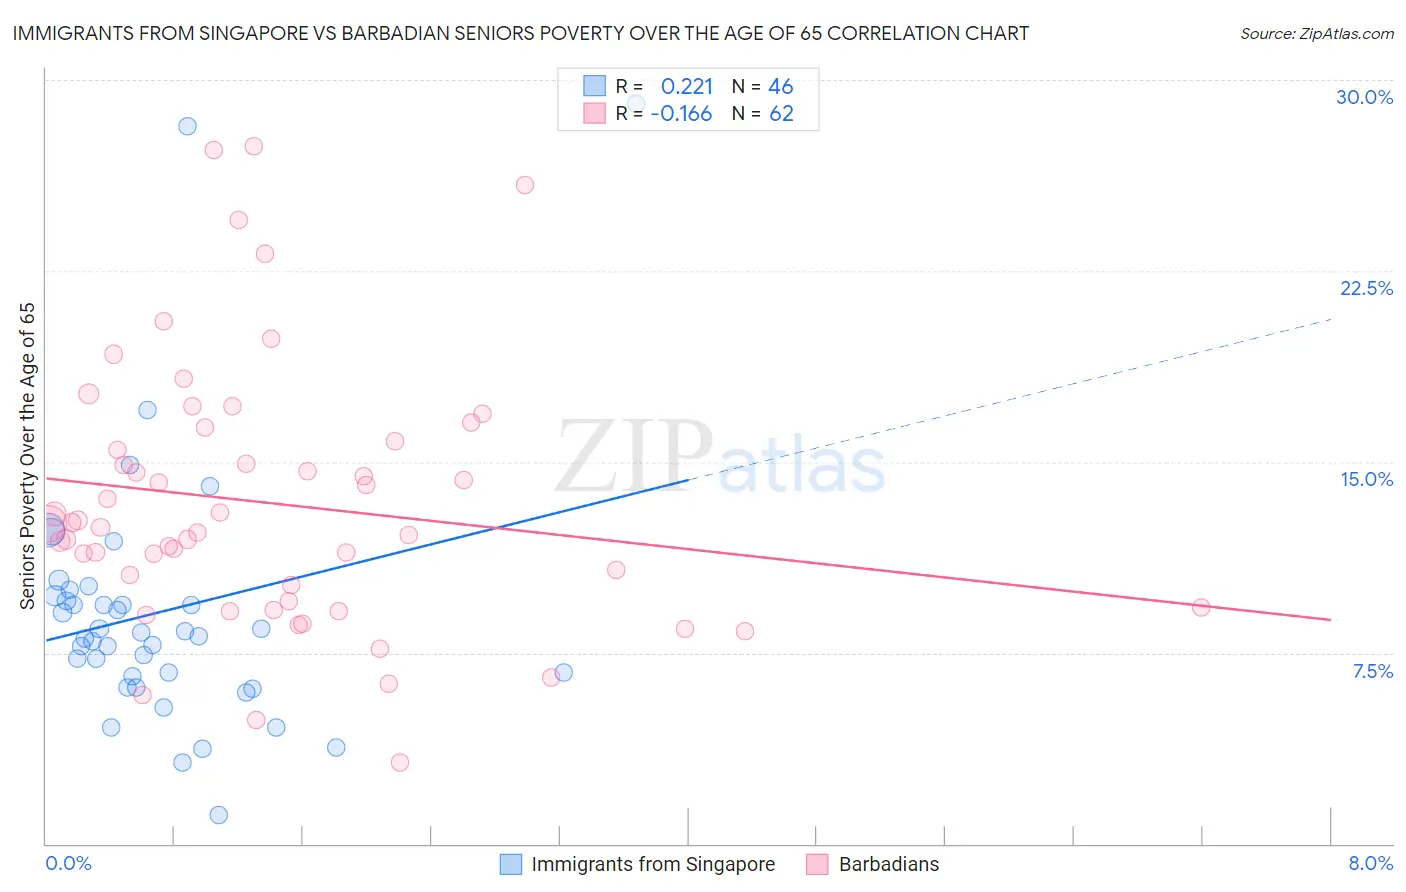
Immigrants from Singapore vs Barbadian Seniors Poverty Over the Age of 65 Correlation Chart
The statistical analysis conducted on geographies consisting of 137,241,054 people shows a weak positive correlation between the proportion of Immigrants from Singapore and poverty level among seniors over the age of 65 in the United States with a correlation coefficient (R) of 0.221 and weighted average of 10.1%. Similarly, the statistical analysis conducted on geographies consisting of 141,112,181 people shows a poor negative correlation between the proportion of Barbadians and poverty level among seniors over the age of 65 in the United States with a correlation coefficient (R) of -0.166 and weighted average of 14.4%, a difference of 42.2%.
Seniors Poverty Over the Age of 65 Correlation Summary
| Measurement | Immigrants from Singapore | Barbadian |
| Minimum | 1.1% | 3.2% |
| Maximum | 29.1% | 27.4% |
| Range | 27.9% | 24.2% |
| Mean | 9.1% | 13.4% |
| Median | 8.2% | 12.5% |
| Interquartile 25% (IQ1) | 6.6% | 9.5% |
| Interquartile 75% (IQ3) | 9.7% | 15.8% |
| Interquartile Range (IQR) | 3.1% | 6.3% |
| Standard Deviation (Sample) | 5.2% | 5.2% |
| Standard Deviation (Population) | 5.1% | 5.1% |
Similar Demographics by Seniors Poverty Over the Age of 65
Demographics Similar to Immigrants from Singapore by Seniors Poverty Over the Age of 65
In terms of seniors poverty over the age of 65, the demographic groups most similar to Immigrants from Singapore are Puget Sound Salish (10.1%, a difference of 0.020%), Ukrainian (10.1%, a difference of 0.040%), Immigrants from Bulgaria (10.1%, a difference of 0.10%), Immigrants from Sweden (10.1%, a difference of 0.11%), and Jordanian (10.1%, a difference of 0.18%).
| Demographics | Rating | Rank | Seniors Poverty Over the Age of 65 |
| Immigrants | Nepal | 97.2 /100 | #85 | Exceptional 10.1% |
| Romanians | 97.2 /100 | #86 | Exceptional 10.1% |
| Burmese | 97.2 /100 | #87 | Exceptional 10.1% |
| Jordanians | 97.1 /100 | #88 | Exceptional 10.1% |
| Immigrants | Bulgaria | 97.0 /100 | #89 | Exceptional 10.1% |
| Ukrainians | 96.9 /100 | #90 | Exceptional 10.1% |
| Puget Sound Salish | 96.9 /100 | #91 | Exceptional 10.1% |
| Immigrants | Singapore | 96.9 /100 | #92 | Exceptional 10.1% |
| Immigrants | Sweden | 96.7 /100 | #93 | Exceptional 10.1% |
| Immigrants | Germany | 96.7 /100 | #94 | Exceptional 10.1% |
| Immigrants | Japan | 96.3 /100 | #95 | Exceptional 10.1% |
| Basques | 95.9 /100 | #96 | Exceptional 10.2% |
| Immigrants | Pakistan | 95.7 /100 | #97 | Exceptional 10.2% |
| Immigrants | Kuwait | 95.5 /100 | #98 | Exceptional 10.2% |
| Cypriots | 95.5 /100 | #99 | Exceptional 10.2% |
Demographics Similar to Barbadians by Seniors Poverty Over the Age of 65
In terms of seniors poverty over the age of 65, the demographic groups most similar to Barbadians are Hispanic or Latino (14.3%, a difference of 0.37%), Guyanese (14.4%, a difference of 0.39%), Immigrants from Ecuador (14.4%, a difference of 0.43%), Immigrants from Guyana (14.5%, a difference of 0.64%), and Haitian (14.5%, a difference of 0.67%).
| Demographics | Rating | Rank | Seniors Poverty Over the Age of 65 |
| Immigrants | Latin America | 0.0 /100 | #306 | Tragic 14.2% |
| Immigrants | West Indies | 0.0 /100 | #307 | Tragic 14.2% |
| Trinidadians and Tobagonians | 0.0 /100 | #308 | Tragic 14.2% |
| Hondurans | 0.0 /100 | #309 | Tragic 14.2% |
| Bahamians | 0.0 /100 | #310 | Tragic 14.2% |
| Natives/Alaskans | 0.0 /100 | #311 | Tragic 14.2% |
| Hispanics or Latinos | 0.0 /100 | #312 | Tragic 14.3% |
| Barbadians | 0.0 /100 | #313 | Tragic 14.4% |
| Guyanese | 0.0 /100 | #314 | Tragic 14.4% |
| Immigrants | Ecuador | 0.0 /100 | #315 | Tragic 14.4% |
| Immigrants | Guyana | 0.0 /100 | #316 | Tragic 14.5% |
| Haitians | 0.0 /100 | #317 | Tragic 14.5% |
| Immigrants | Honduras | 0.0 /100 | #318 | Tragic 14.5% |
| Cape Verdeans | 0.0 /100 | #319 | Tragic 14.7% |
| Immigrants | Haiti | 0.0 /100 | #320 | Tragic 14.7% |