Inupiat vs Aleut Seniors Poverty Over the Age of 65
COMPARE
Inupiat
Aleut
Seniors Poverty Over the Age of 65
Seniors Poverty Over the Age of 65 Comparison
Inupiat
Aleuts
12.6%
SENIORS POVERTY OVER THE AGE OF 65
0.1/ 100
METRIC RATING
264th/ 347
METRIC RANK
10.3%
SENIORS POVERTY OVER THE AGE OF 65
94.1/ 100
METRIC RATING
105th/ 347
METRIC RANK
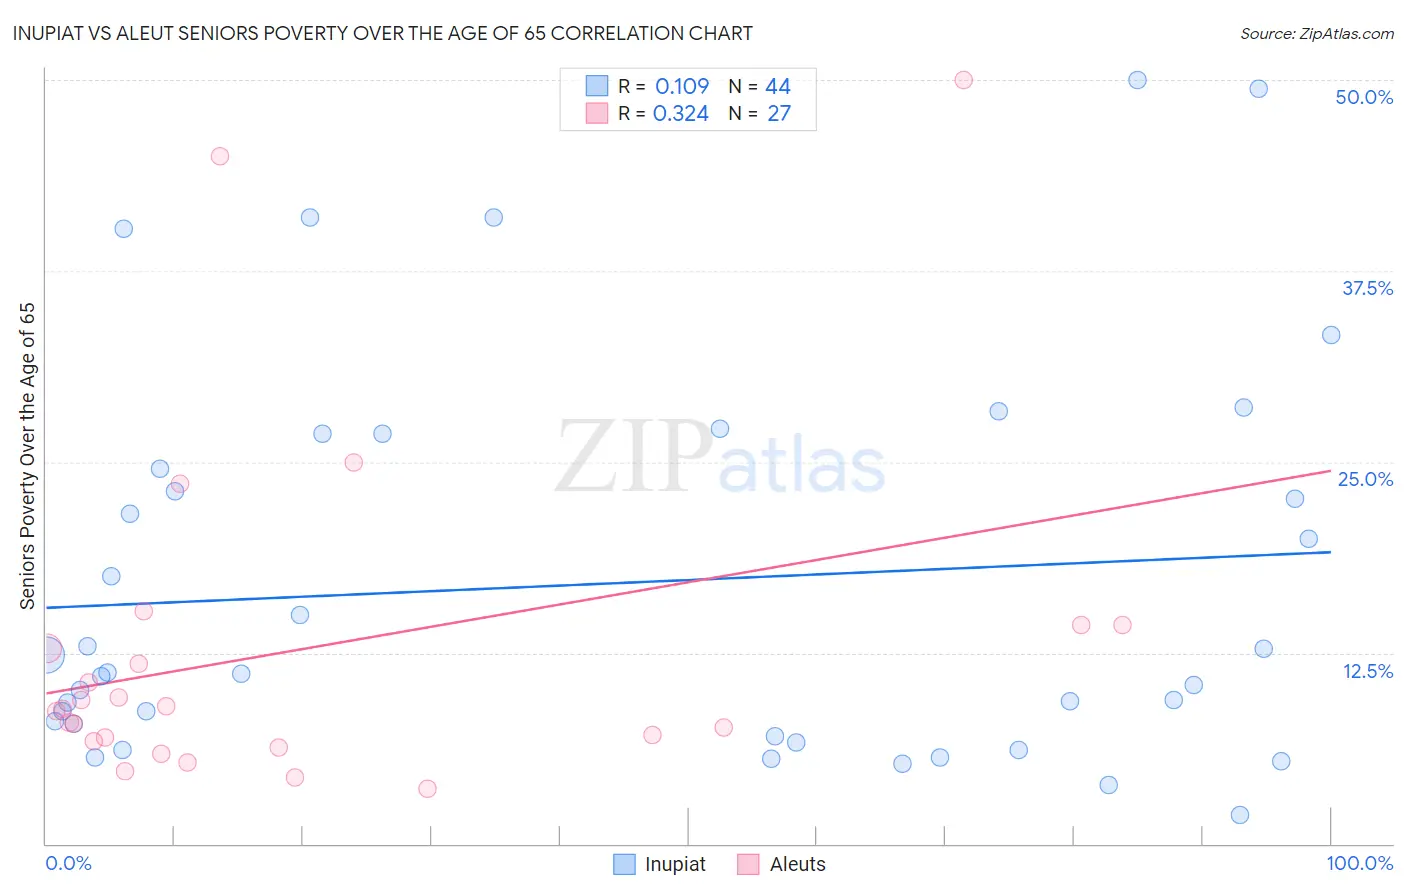
Inupiat vs Aleut Seniors Poverty Over the Age of 65 Correlation Chart
The statistical analysis conducted on geographies consisting of 96,149,524 people shows a poor positive correlation between the proportion of Inupiat and poverty level among seniors over the age of 65 in the United States with a correlation coefficient (R) of 0.109 and weighted average of 12.6%. Similarly, the statistical analysis conducted on geographies consisting of 61,670,164 people shows a mild positive correlation between the proportion of Aleuts and poverty level among seniors over the age of 65 in the United States with a correlation coefficient (R) of 0.324 and weighted average of 10.3%, a difference of 22.4%.
Seniors Poverty Over the Age of 65 Correlation Summary
| Measurement | Inupiat | Aleut |
| Minimum | 1.9% | 3.6% |
| Maximum | 50.0% | 50.0% |
| Range | 48.1% | 46.4% |
| Mean | 17.0% | 12.7% |
| Median | 11.2% | 8.9% |
| Interquartile 25% (IQ1) | 7.5% | 6.7% |
| Interquartile 75% (IQ3) | 25.7% | 14.3% |
| Interquartile Range (IQR) | 18.2% | 7.6% |
| Standard Deviation (Sample) | 12.8% | 11.3% |
| Standard Deviation (Population) | 12.7% | 11.1% |
Similar Demographics by Seniors Poverty Over the Age of 65
Demographics Similar to Inupiat by Seniors Poverty Over the Age of 65
In terms of seniors poverty over the age of 65, the demographic groups most similar to Inupiat are Soviet Union (12.6%, a difference of 0.070%), Immigrants from Western Africa (12.6%, a difference of 0.090%), Venezuelan (12.5%, a difference of 0.23%), African (12.6%, a difference of 0.26%), and Blackfeet (12.6%, a difference of 0.40%).
| Demographics | Rating | Rank | Seniors Poverty Over the Age of 65 |
| Immigrants | Immigrants | 0.2 /100 | #257 | Tragic 12.4% |
| Dutch West Indians | 0.2 /100 | #258 | Tragic 12.4% |
| Ghanaians | 0.2 /100 | #259 | Tragic 12.4% |
| South Americans | 0.2 /100 | #260 | Tragic 12.5% |
| Colombians | 0.2 /100 | #261 | Tragic 12.5% |
| Venezuelans | 0.1 /100 | #262 | Tragic 12.5% |
| Soviet Union | 0.1 /100 | #263 | Tragic 12.6% |
| Inupiat | 0.1 /100 | #264 | Tragic 12.6% |
| Immigrants | Western Africa | 0.1 /100 | #265 | Tragic 12.6% |
| Africans | 0.1 /100 | #266 | Tragic 12.6% |
| Blackfeet | 0.1 /100 | #267 | Tragic 12.6% |
| Immigrants | Somalia | 0.1 /100 | #268 | Tragic 12.6% |
| Immigrants | Venezuela | 0.1 /100 | #269 | Tragic 12.7% |
| Immigrants | South America | 0.1 /100 | #270 | Tragic 12.7% |
| Immigrants | Ghana | 0.1 /100 | #271 | Tragic 12.8% |
Demographics Similar to Aleuts by Seniors Poverty Over the Age of 65
In terms of seniors poverty over the age of 65, the demographic groups most similar to Aleuts are Kenyan (10.3%, a difference of 0.020%), South African (10.3%, a difference of 0.070%), Hawaiian (10.3%, a difference of 0.090%), Immigrants from Croatia (10.3%, a difference of 0.090%), and Icelander (10.3%, a difference of 0.11%).
| Demographics | Rating | Rank | Seniors Poverty Over the Age of 65 |
| Immigrants | Kuwait | 95.5 /100 | #98 | Exceptional 10.2% |
| Cypriots | 95.5 /100 | #99 | Exceptional 10.2% |
| Marshallese | 95.3 /100 | #100 | Exceptional 10.2% |
| Immigrants | Jordan | 94.7 /100 | #101 | Exceptional 10.2% |
| Delaware | 94.5 /100 | #102 | Exceptional 10.2% |
| Icelanders | 94.4 /100 | #103 | Exceptional 10.3% |
| South Africans | 94.3 /100 | #104 | Exceptional 10.3% |
| Aleuts | 94.1 /100 | #105 | Exceptional 10.3% |
| Kenyans | 94.1 /100 | #106 | Exceptional 10.3% |
| Hawaiians | 93.9 /100 | #107 | Exceptional 10.3% |
| Immigrants | Croatia | 93.9 /100 | #108 | Exceptional 10.3% |
| Syrians | 93.8 /100 | #109 | Exceptional 10.3% |
| Immigrants | Zimbabwe | 93.5 /100 | #110 | Exceptional 10.3% |
| Immigrants | Belgium | 93.4 /100 | #111 | Exceptional 10.3% |
| Immigrants | Korea | 93.3 /100 | #112 | Exceptional 10.3% |