Indonesian vs Belgian Female Poverty Among 25-34 Year Olds
COMPARE
Indonesian
Belgian
Female Poverty Among 25-34 Year Olds
Female Poverty Among 25-34 Year Olds Comparison
Indonesians
Belgians
16.4%
FEMALE POVERTY AMONG 25-34 YEAR OLDS
0.0/ 100
METRIC RATING
290th/ 347
METRIC RANK
13.4%
FEMALE POVERTY AMONG 25-34 YEAR OLDS
58.9/ 100
METRIC RATING
166th/ 347
METRIC RANK
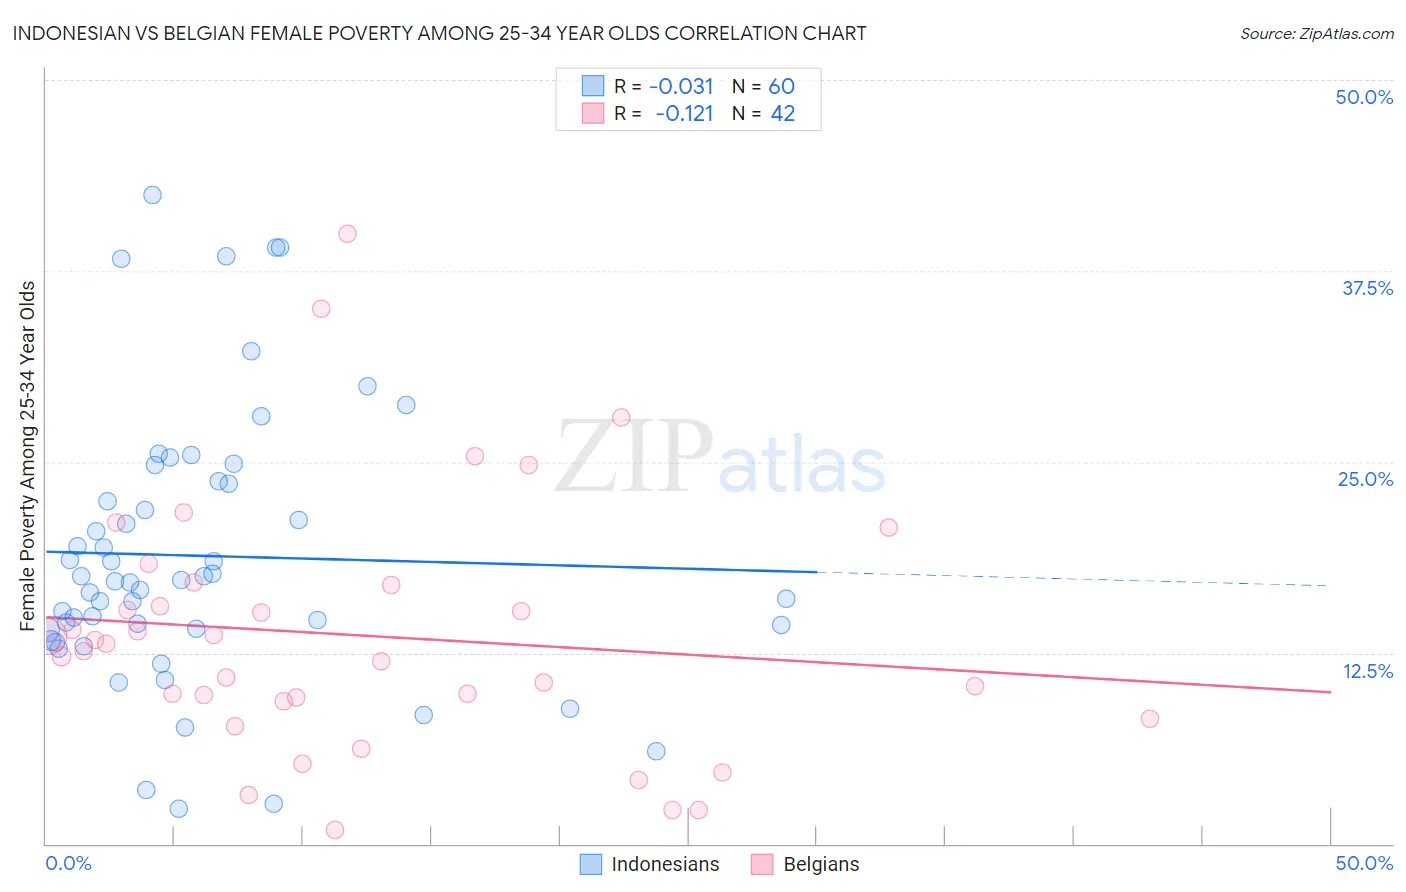
Indonesian vs Belgian Female Poverty Among 25-34 Year Olds Correlation Chart
The statistical analysis conducted on geographies consisting of 161,815,054 people shows no correlation between the proportion of Indonesians and poverty level among females between the ages 25 and 34 in the United States with a correlation coefficient (R) of -0.031 and weighted average of 16.4%. Similarly, the statistical analysis conducted on geographies consisting of 349,537,214 people shows a poor negative correlation between the proportion of Belgians and poverty level among females between the ages 25 and 34 in the United States with a correlation coefficient (R) of -0.121 and weighted average of 13.4%, a difference of 22.3%.
Female Poverty Among 25-34 Year Olds Correlation Summary
| Measurement | Indonesian | Belgian |
| Minimum | 2.3% | 0.91% |
| Maximum | 42.5% | 39.9% |
| Range | 40.2% | 39.0% |
| Mean | 18.9% | 13.6% |
| Median | 17.2% | 12.9% |
| Interquartile 25% (IQ1) | 14.1% | 9.4% |
| Interquartile 75% (IQ3) | 23.6% | 16.9% |
| Interquartile Range (IQR) | 9.6% | 7.6% |
| Standard Deviation (Sample) | 8.9% | 8.3% |
| Standard Deviation (Population) | 8.9% | 8.2% |
Similar Demographics by Female Poverty Among 25-34 Year Olds
Demographics Similar to Indonesians by Female Poverty Among 25-34 Year Olds
In terms of female poverty among 25-34 year olds, the demographic groups most similar to Indonesians are Osage (16.4%, a difference of 0.16%), Guatemalan (16.4%, a difference of 0.22%), Comanche (16.5%, a difference of 0.28%), Immigrants from Dominica (16.5%, a difference of 0.30%), and American (16.4%, a difference of 0.40%).
| Demographics | Rating | Rank | Female Poverty Among 25-34 Year Olds |
| Bahamians | 0.0 /100 | #283 | Tragic 16.1% |
| Shoshone | 0.0 /100 | #284 | Tragic 16.2% |
| Immigrants | Bahamas | 0.0 /100 | #285 | Tragic 16.3% |
| Cape Verdeans | 0.0 /100 | #286 | Tragic 16.3% |
| Americans | 0.0 /100 | #287 | Tragic 16.4% |
| Guatemalans | 0.0 /100 | #288 | Tragic 16.4% |
| Osage | 0.0 /100 | #289 | Tragic 16.4% |
| Indonesians | 0.0 /100 | #290 | Tragic 16.4% |
| Comanche | 0.0 /100 | #291 | Tragic 16.5% |
| Immigrants | Dominica | 0.0 /100 | #292 | Tragic 16.5% |
| Potawatomi | 0.0 /100 | #293 | Tragic 16.5% |
| Immigrants | Central America | 0.0 /100 | #294 | Tragic 16.6% |
| Mexicans | 0.0 /100 | #295 | Tragic 16.6% |
| Hispanics or Latinos | 0.0 /100 | #296 | Tragic 16.6% |
| Immigrants | Guatemala | 0.0 /100 | #297 | Tragic 16.6% |
Demographics Similar to Belgians by Female Poverty Among 25-34 Year Olds
In terms of female poverty among 25-34 year olds, the demographic groups most similar to Belgians are Immigrants from Bosnia and Herzegovina (13.4%, a difference of 0.020%), Basque (13.4%, a difference of 0.030%), Immigrants from Afghanistan (13.4%, a difference of 0.10%), Samoan (13.5%, a difference of 0.18%), and Swiss (13.4%, a difference of 0.24%).
| Demographics | Rating | Rank | Female Poverty Among 25-34 Year Olds |
| Uruguayans | 66.9 /100 | #159 | Good 13.3% |
| Immigrants | South America | 66.3 /100 | #160 | Good 13.3% |
| Icelanders | 65.7 /100 | #161 | Good 13.3% |
| Ugandans | 64.1 /100 | #162 | Good 13.4% |
| British | 63.5 /100 | #163 | Good 13.4% |
| Swiss | 61.7 /100 | #164 | Good 13.4% |
| Basques | 59.3 /100 | #165 | Average 13.4% |
| Belgians | 58.9 /100 | #166 | Average 13.4% |
| Immigrants | Bosnia and Herzegovina | 58.6 /100 | #167 | Average 13.4% |
| Immigrants | Afghanistan | 57.7 /100 | #168 | Average 13.4% |
| Samoans | 56.8 /100 | #169 | Average 13.5% |
| Immigrants | Uganda | 53.0 /100 | #170 | Average 13.5% |
| South American Indians | 51.9 /100 | #171 | Average 13.5% |
| Immigrants | Costa Rica | 51.9 /100 | #172 | Average 13.5% |
| Kenyans | 51.8 /100 | #173 | Average 13.5% |