Immigrants vs Immigrants from Laos Child Poverty Under the Age of 16
COMPARE
Immigrants
Immigrants from Laos
Child Poverty Under the Age of 16
Child Poverty Under the Age of 16 Comparison
Immigrants
Immigrants from Laos
17.5%
CHILD POVERTY UNDER THE AGE OF 16
6.5/ 100
METRIC RATING
212th/ 347
METRIC RANK
18.7%
CHILD POVERTY UNDER THE AGE OF 16
0.6/ 100
METRIC RATING
242nd/ 347
METRIC RANK
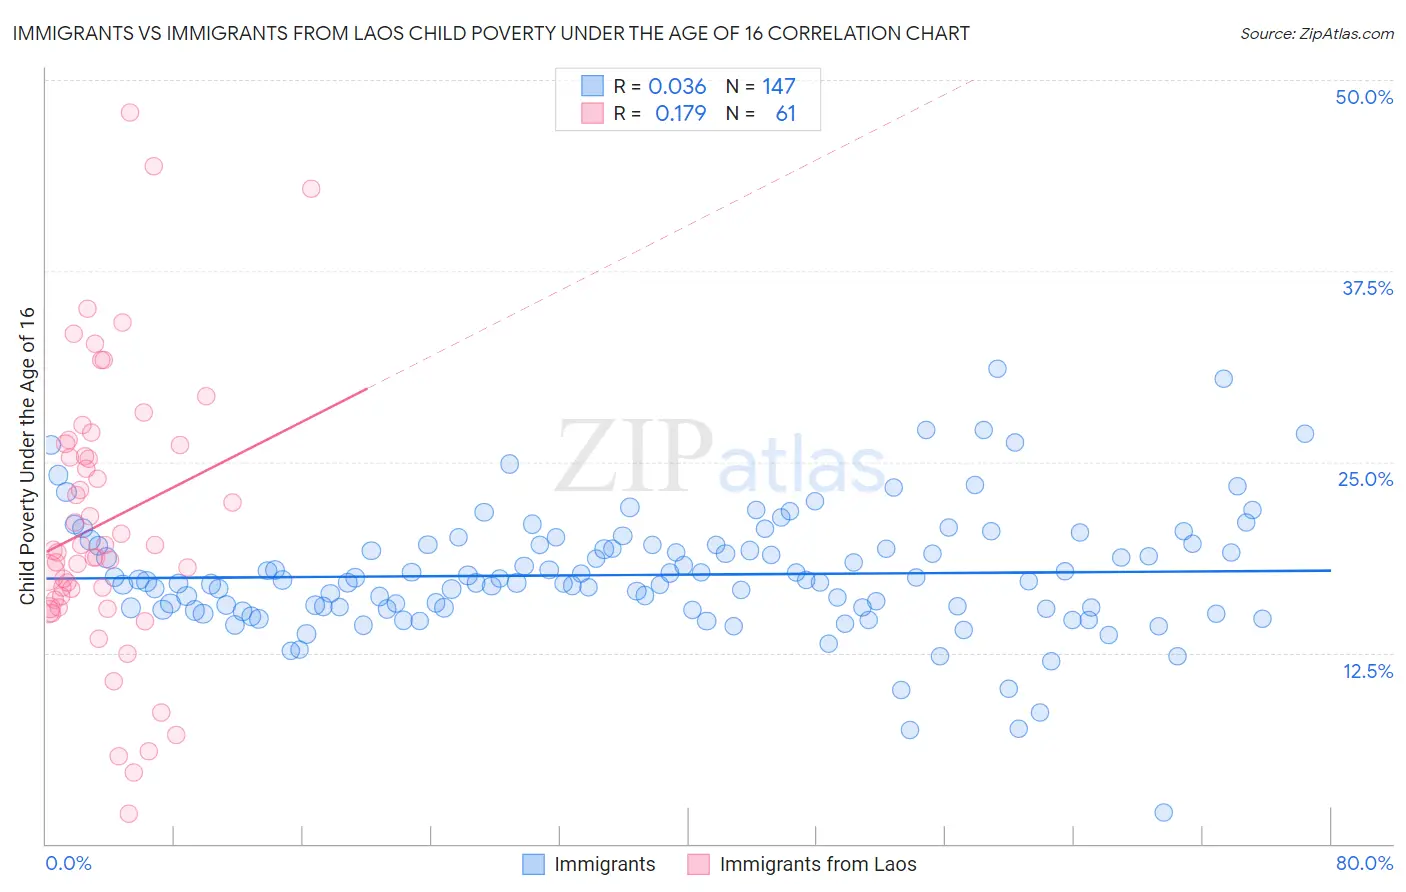
Immigrants vs Immigrants from Laos Child Poverty Under the Age of 16 Correlation Chart
The statistical analysis conducted on geographies consisting of 564,478,832 people shows no correlation between the proportion of Immigrants and poverty level among children under the age of 16 in the United States with a correlation coefficient (R) of 0.036 and weighted average of 17.5%. Similarly, the statistical analysis conducted on geographies consisting of 200,797,762 people shows a poor positive correlation between the proportion of Immigrants from Laos and poverty level among children under the age of 16 in the United States with a correlation coefficient (R) of 0.179 and weighted average of 18.7%, a difference of 6.7%.
Child Poverty Under the Age of 16 Correlation Summary
| Measurement | Immigrants | Immigrants from Laos |
| Minimum | 2.1% | 2.0% |
| Maximum | 31.1% | 47.9% |
| Range | 29.0% | 45.9% |
| Mean | 17.6% | 21.0% |
| Median | 17.2% | 19.2% |
| Interquartile 25% (IQ1) | 15.4% | 15.7% |
| Interquartile 75% (IQ3) | 19.6% | 26.1% |
| Interquartile Range (IQR) | 4.2% | 10.4% |
| Standard Deviation (Sample) | 4.0% | 9.2% |
| Standard Deviation (Population) | 4.0% | 9.1% |
Similar Demographics by Child Poverty Under the Age of 16
Demographics Similar to Immigrants by Child Poverty Under the Age of 16
In terms of child poverty under the age of 16, the demographic groups most similar to Immigrants are Immigrants from Thailand (17.5%, a difference of 0.020%), Alaskan Athabascan (17.5%, a difference of 0.15%), Panamanian (17.5%, a difference of 0.16%), Immigrants from the Azores (17.5%, a difference of 0.17%), and Iraqi (17.5%, a difference of 0.29%).
| Demographics | Rating | Rank | Child Poverty Under the Age of 16 |
| Aleuts | 13.9 /100 | #205 | Poor 17.1% |
| Alaska Natives | 11.8 /100 | #206 | Poor 17.2% |
| German Russians | 8.6 /100 | #207 | Tragic 17.4% |
| Pennsylvania Germans | 7.5 /100 | #208 | Tragic 17.4% |
| Panamanians | 6.9 /100 | #209 | Tragic 17.5% |
| Alaskan Athabascans | 6.9 /100 | #210 | Tragic 17.5% |
| Immigrants | Thailand | 6.6 /100 | #211 | Tragic 17.5% |
| Immigrants | Immigrants | 6.5 /100 | #212 | Tragic 17.5% |
| Immigrants | Azores | 6.2 /100 | #213 | Tragic 17.5% |
| Iraqis | 5.9 /100 | #214 | Tragic 17.5% |
| Malaysians | 5.9 /100 | #215 | Tragic 17.5% |
| Sierra Leoneans | 5.7 /100 | #216 | Tragic 17.6% |
| Immigrants | Eastern Africa | 5.3 /100 | #217 | Tragic 17.6% |
| Moroccans | 5.3 /100 | #218 | Tragic 17.6% |
| Japanese | 4.7 /100 | #219 | Tragic 17.7% |
Demographics Similar to Immigrants from Laos by Child Poverty Under the Age of 16
In terms of child poverty under the age of 16, the demographic groups most similar to Immigrants from Laos are Alsatian (18.6%, a difference of 0.11%), Immigrants from Cuba (18.7%, a difference of 0.13%), Cape Verdean (18.7%, a difference of 0.20%), Ghanaian (18.6%, a difference of 0.58%), and Immigrants from Sudan (18.5%, a difference of 0.63%).
| Demographics | Rating | Rank | Child Poverty Under the Age of 16 |
| Nigerians | 1.0 /100 | #235 | Tragic 18.4% |
| Cree | 0.9 /100 | #236 | Tragic 18.5% |
| Sudanese | 0.9 /100 | #237 | Tragic 18.5% |
| Immigrants | Eritrea | 0.8 /100 | #238 | Tragic 18.5% |
| Immigrants | Sudan | 0.8 /100 | #239 | Tragic 18.5% |
| Ghanaians | 0.8 /100 | #240 | Tragic 18.6% |
| Alsatians | 0.7 /100 | #241 | Tragic 18.6% |
| Immigrants | Laos | 0.6 /100 | #242 | Tragic 18.7% |
| Immigrants | Cuba | 0.6 /100 | #243 | Tragic 18.7% |
| Cape Verdeans | 0.6 /100 | #244 | Tragic 18.7% |
| Shoshone | 0.5 /100 | #245 | Tragic 18.8% |
| Immigrants | Nicaragua | 0.4 /100 | #246 | Tragic 18.8% |
| French American Indians | 0.4 /100 | #247 | Tragic 18.9% |
| Ecuadorians | 0.3 /100 | #248 | Tragic 19.0% |
| Potawatomi | 0.3 /100 | #249 | Tragic 19.0% |