Immigrants from Africa vs Immigrants from Laos Child Poverty Under the Age of 16
COMPARE
Immigrants from Africa
Immigrants from Laos
Child Poverty Under the Age of 16
Child Poverty Under the Age of 16 Comparison
Immigrants from Africa
Immigrants from Laos
18.0%
CHILD POVERTY UNDER THE AGE OF 16
2.5/ 100
METRIC RATING
227th/ 347
METRIC RANK
18.7%
CHILD POVERTY UNDER THE AGE OF 16
0.6/ 100
METRIC RATING
242nd/ 347
METRIC RANK
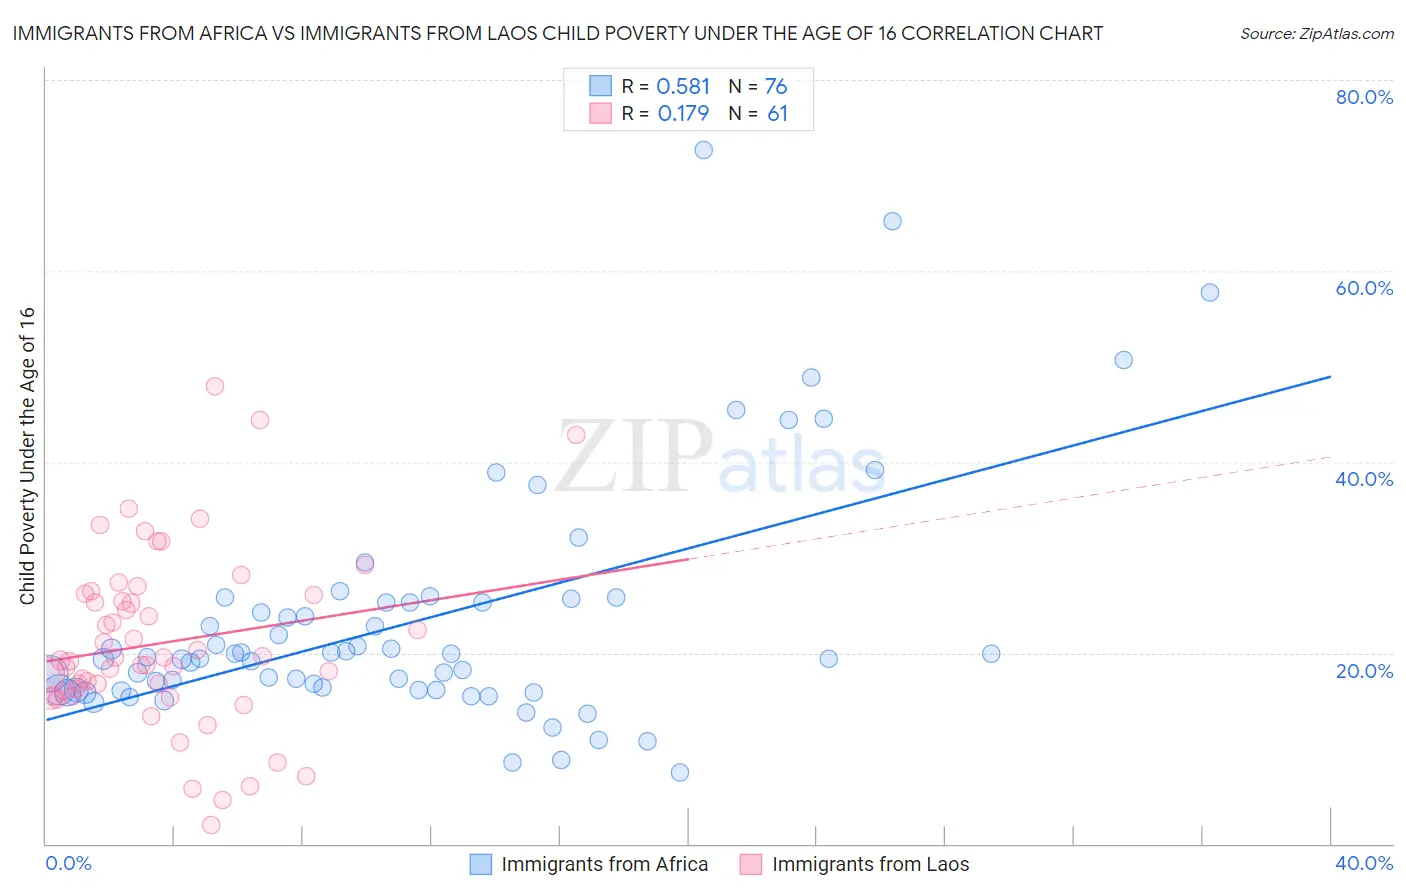
Immigrants from Africa vs Immigrants from Laos Child Poverty Under the Age of 16 Correlation Chart
The statistical analysis conducted on geographies consisting of 464,107,258 people shows a substantial positive correlation between the proportion of Immigrants from Africa and poverty level among children under the age of 16 in the United States with a correlation coefficient (R) of 0.581 and weighted average of 18.0%. Similarly, the statistical analysis conducted on geographies consisting of 200,797,762 people shows a poor positive correlation between the proportion of Immigrants from Laos and poverty level among children under the age of 16 in the United States with a correlation coefficient (R) of 0.179 and weighted average of 18.7%, a difference of 3.7%.
Child Poverty Under the Age of 16 Correlation Summary
| Measurement | Immigrants from Africa | Immigrants from Laos |
| Minimum | 7.4% | 2.0% |
| Maximum | 72.6% | 47.9% |
| Range | 65.2% | 45.9% |
| Mean | 23.3% | 21.0% |
| Median | 19.5% | 19.2% |
| Interquartile 25% (IQ1) | 16.1% | 15.7% |
| Interquartile 75% (IQ3) | 25.3% | 26.1% |
| Interquartile Range (IQR) | 9.1% | 10.4% |
| Standard Deviation (Sample) | 12.5% | 9.2% |
| Standard Deviation (Population) | 12.4% | 9.1% |
Demographics Similar to Immigrants from Africa and Immigrants from Laos by Child Poverty Under the Age of 16
In terms of child poverty under the age of 16, the demographic groups most similar to Immigrants from Africa are Immigrants from Micronesia (18.0%, a difference of 0.15%), Bermudan (18.0%, a difference of 0.18%), Nonimmigrants (17.9%, a difference of 0.25%), Osage (17.9%, a difference of 0.62%), and Marshallese (18.1%, a difference of 0.88%). Similarly, the demographic groups most similar to Immigrants from Laos are Alsatian (18.6%, a difference of 0.11%), Immigrants from Cuba (18.7%, a difference of 0.13%), Cape Verdean (18.7%, a difference of 0.20%), Ghanaian (18.6%, a difference of 0.58%), and Immigrants from Sudan (18.5%, a difference of 0.63%).
| Demographics | Rating | Rank | Child Poverty Under the Age of 16 |
| Osage | 3.1 /100 | #224 | Tragic 17.9% |
| Immigrants | Nonimmigrants | 2.7 /100 | #225 | Tragic 17.9% |
| Bermudans | 2.6 /100 | #226 | Tragic 18.0% |
| Immigrants | Africa | 2.5 /100 | #227 | Tragic 18.0% |
| Immigrants | Micronesia | 2.3 /100 | #228 | Tragic 18.0% |
| Marshallese | 1.8 /100 | #229 | Tragic 18.1% |
| Nepalese | 1.7 /100 | #230 | Tragic 18.2% |
| Nicaraguans | 1.7 /100 | #231 | Tragic 18.2% |
| Americans | 1.2 /100 | #232 | Tragic 18.3% |
| Fijians | 1.1 /100 | #233 | Tragic 18.4% |
| Immigrants | Nigeria | 1.0 /100 | #234 | Tragic 18.4% |
| Nigerians | 1.0 /100 | #235 | Tragic 18.4% |
| Cree | 0.9 /100 | #236 | Tragic 18.5% |
| Sudanese | 0.9 /100 | #237 | Tragic 18.5% |
| Immigrants | Eritrea | 0.8 /100 | #238 | Tragic 18.5% |
| Immigrants | Sudan | 0.8 /100 | #239 | Tragic 18.5% |
| Ghanaians | 0.8 /100 | #240 | Tragic 18.6% |
| Alsatians | 0.7 /100 | #241 | Tragic 18.6% |
| Immigrants | Laos | 0.6 /100 | #242 | Tragic 18.7% |
| Immigrants | Cuba | 0.6 /100 | #243 | Tragic 18.7% |
| Cape Verdeans | 0.6 /100 | #244 | Tragic 18.7% |