Immigrants from Yemen vs Immigrants from Sri Lanka Seniors Poverty Over the Age of 75
COMPARE
Immigrants from Yemen
Immigrants from Sri Lanka
Seniors Poverty Over the Age of 75
Seniors Poverty Over the Age of 75 Comparison
Immigrants from Yemen
Immigrants from Sri Lanka
16.5%
SENIORS POVERTY OVER THE AGE OF 75
0.0/ 100
METRIC RATING
320th/ 347
METRIC RANK
11.5%
SENIORS POVERTY OVER THE AGE OF 75
94.4/ 100
METRIC RATING
89th/ 347
METRIC RANK
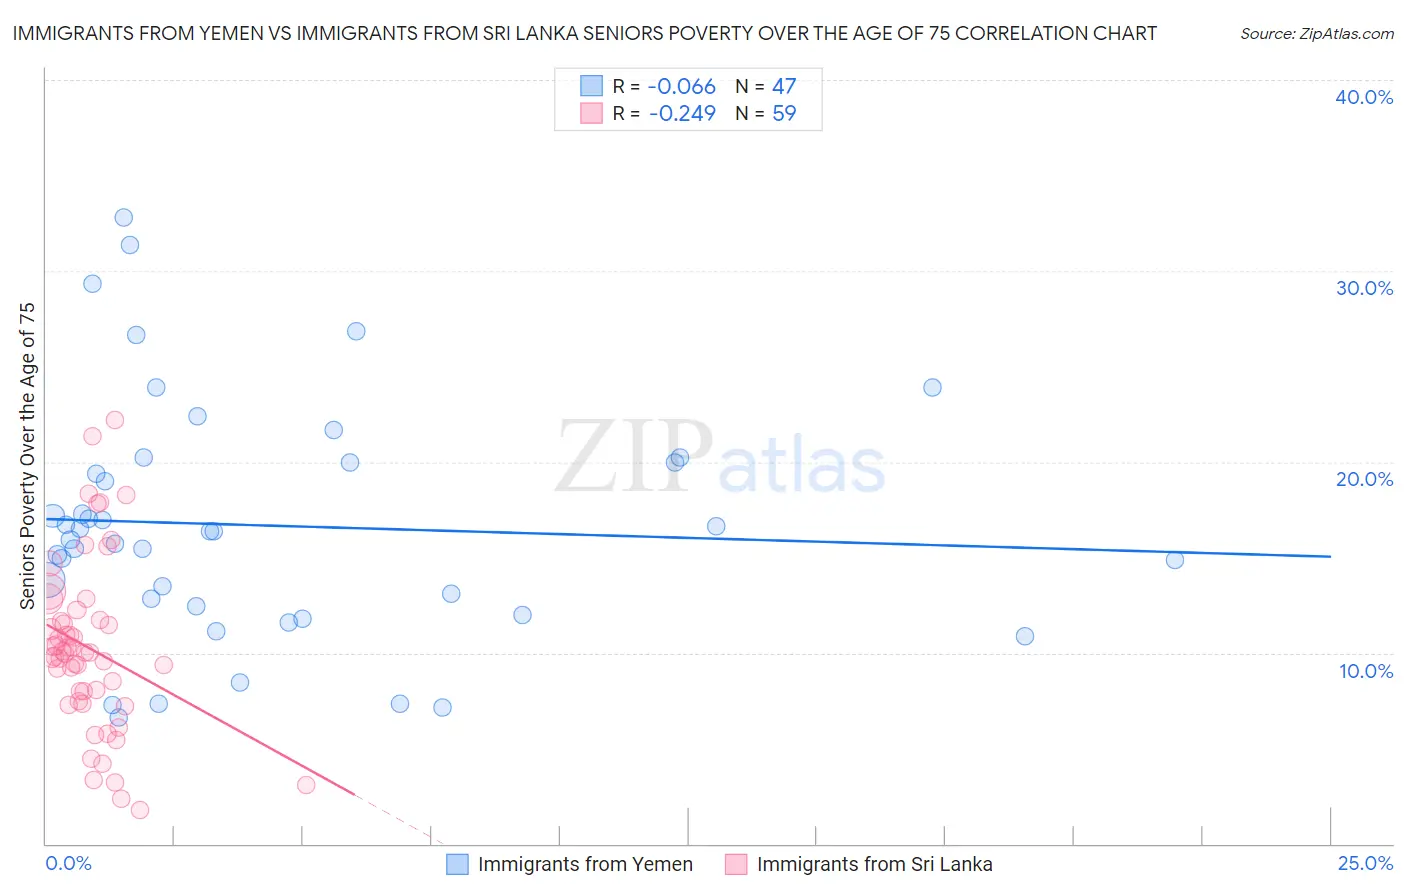
Immigrants from Yemen vs Immigrants from Sri Lanka Seniors Poverty Over the Age of 75 Correlation Chart
The statistical analysis conducted on geographies consisting of 82,233,143 people shows a slight negative correlation between the proportion of Immigrants from Yemen and poverty level among seniors over the age of 75 in the United States with a correlation coefficient (R) of -0.066 and weighted average of 16.5%. Similarly, the statistical analysis conducted on geographies consisting of 149,120,503 people shows a weak negative correlation between the proportion of Immigrants from Sri Lanka and poverty level among seniors over the age of 75 in the United States with a correlation coefficient (R) of -0.249 and weighted average of 11.5%, a difference of 43.5%.
Seniors Poverty Over the Age of 75 Correlation Summary
| Measurement | Immigrants from Yemen | Immigrants from Sri Lanka |
| Minimum | 6.6% | 1.8% |
| Maximum | 32.8% | 22.2% |
| Range | 26.2% | 20.4% |
| Mean | 16.7% | 10.2% |
| Median | 16.4% | 10.0% |
| Interquartile 25% (IQ1) | 12.4% | 7.4% |
| Interquartile 75% (IQ3) | 20.0% | 11.7% |
| Interquartile Range (IQR) | 7.6% | 4.3% |
| Standard Deviation (Sample) | 6.3% | 4.4% |
| Standard Deviation (Population) | 6.2% | 4.4% |
Similar Demographics by Seniors Poverty Over the Age of 75
Demographics Similar to Immigrants from Yemen by Seniors Poverty Over the Age of 75
In terms of seniors poverty over the age of 75, the demographic groups most similar to Immigrants from Yemen are Immigrants from Haiti (16.5%, a difference of 0.18%), Immigrants from Barbados (16.5%, a difference of 0.21%), Central American Indian (16.5%, a difference of 0.30%), Immigrants from Uzbekistan (16.5%, a difference of 0.35%), and Nicaraguan (16.6%, a difference of 0.73%).
| Demographics | Rating | Rank | Seniors Poverty Over the Age of 75 |
| Barbadians | 0.0 /100 | #313 | Tragic 16.0% |
| Tsimshian | 0.0 /100 | #314 | Tragic 16.1% |
| Guyanese | 0.0 /100 | #315 | Tragic 16.1% |
| Immigrants | Ecuador | 0.0 /100 | #316 | Tragic 16.1% |
| Immigrants | Guyana | 0.0 /100 | #317 | Tragic 16.2% |
| Houma | 0.0 /100 | #318 | Tragic 16.2% |
| Haitians | 0.0 /100 | #319 | Tragic 16.2% |
| Immigrants | Yemen | 0.0 /100 | #320 | Tragic 16.5% |
| Immigrants | Haiti | 0.0 /100 | #321 | Tragic 16.5% |
| Immigrants | Barbados | 0.0 /100 | #322 | Tragic 16.5% |
| Central American Indians | 0.0 /100 | #323 | Tragic 16.5% |
| Immigrants | Uzbekistan | 0.0 /100 | #324 | Tragic 16.5% |
| Nicaraguans | 0.0 /100 | #325 | Tragic 16.6% |
| Pueblo | 0.0 /100 | #326 | Tragic 16.7% |
| Sioux | 0.0 /100 | #327 | Tragic 16.8% |
Demographics Similar to Immigrants from Sri Lanka by Seniors Poverty Over the Age of 75
In terms of seniors poverty over the age of 75, the demographic groups most similar to Immigrants from Sri Lanka are Immigrants from Croatia (11.5%, a difference of 0.030%), Korean (11.5%, a difference of 0.050%), Australian (11.5%, a difference of 0.080%), Immigrants from Bulgaria (11.5%, a difference of 0.10%), and Aleut (11.5%, a difference of 0.11%).
| Demographics | Rating | Rank | Seniors Poverty Over the Age of 75 |
| Iranians | 95.1 /100 | #82 | Exceptional 11.5% |
| Immigrants | South Africa | 94.9 /100 | #83 | Exceptional 11.5% |
| Immigrants | Iraq | 94.9 /100 | #84 | Exceptional 11.5% |
| Immigrants | Bulgaria | 94.7 /100 | #85 | Exceptional 11.5% |
| Australians | 94.6 /100 | #86 | Exceptional 11.5% |
| Koreans | 94.5 /100 | #87 | Exceptional 11.5% |
| Immigrants | Croatia | 94.5 /100 | #88 | Exceptional 11.5% |
| Immigrants | Sri Lanka | 94.4 /100 | #89 | Exceptional 11.5% |
| Aleuts | 94.1 /100 | #90 | Exceptional 11.5% |
| Immigrants | Germany | 94.1 /100 | #91 | Exceptional 11.5% |
| Kenyans | 93.9 /100 | #92 | Exceptional 11.5% |
| Immigrants | Poland | 92.9 /100 | #93 | Exceptional 11.6% |
| Creek | 92.7 /100 | #94 | Exceptional 11.6% |
| Immigrants | Bosnia and Herzegovina | 92.6 /100 | #95 | Exceptional 11.6% |
| Immigrants | Sweden | 92.6 /100 | #96 | Exceptional 11.6% |