Immigrants from the Azores vs Immigrants from Sri Lanka Seniors Poverty Over the Age of 75
COMPARE
Immigrants from the Azores
Immigrants from Sri Lanka
Seniors Poverty Over the Age of 75
Seniors Poverty Over the Age of 75 Comparison
Immigrants from the Azores
Immigrants from Sri Lanka
15.2%
SENIORS POVERTY OVER THE AGE OF 75
0.0/ 100
METRIC RATING
290th/ 347
METRIC RANK
11.5%
SENIORS POVERTY OVER THE AGE OF 75
94.4/ 100
METRIC RATING
89th/ 347
METRIC RANK
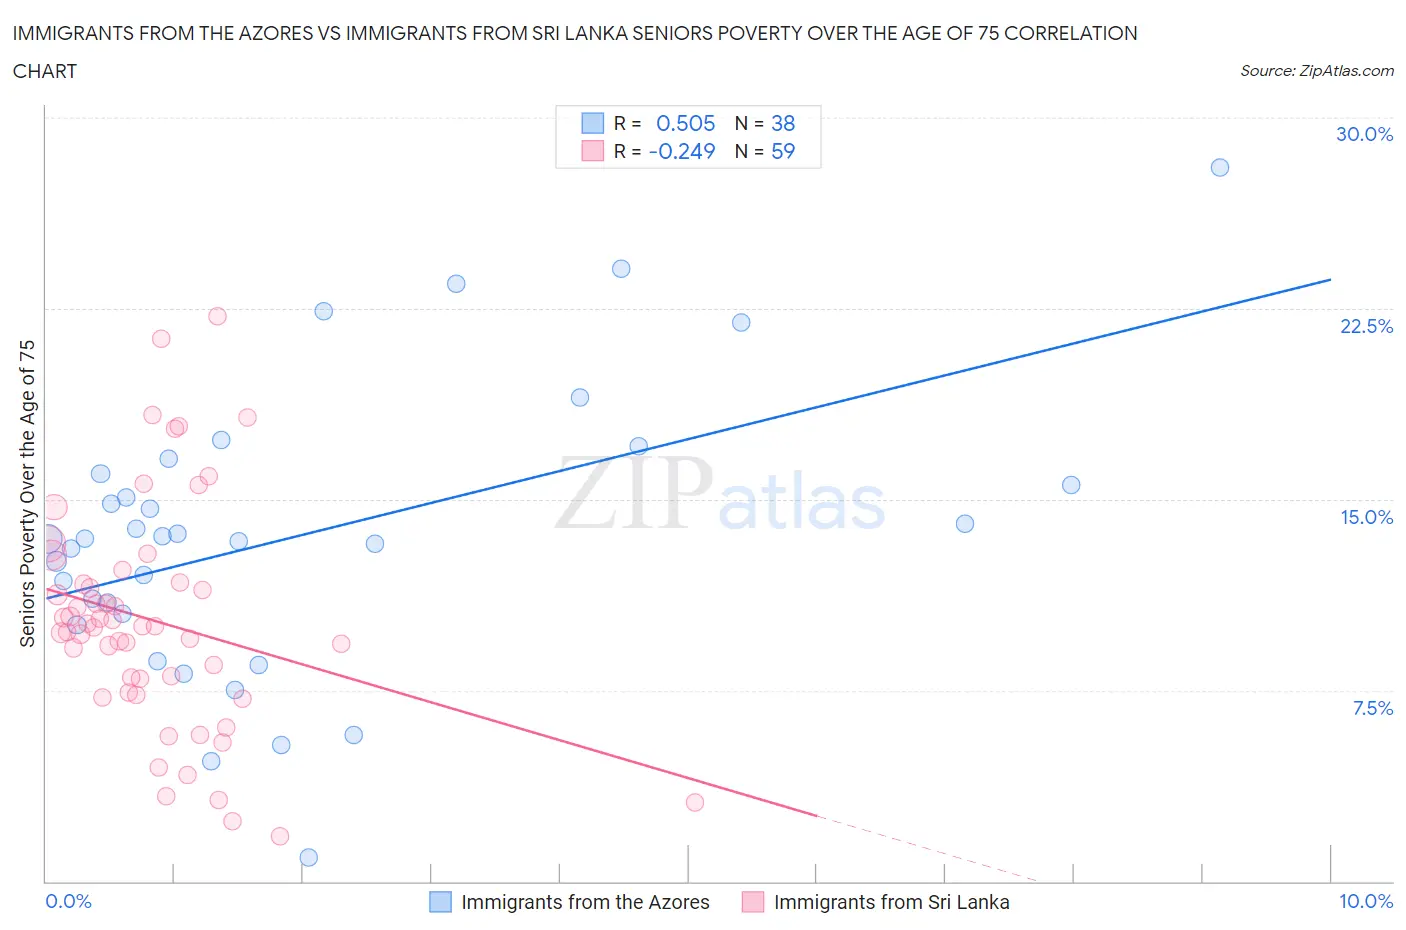
Immigrants from the Azores vs Immigrants from Sri Lanka Seniors Poverty Over the Age of 75 Correlation Chart
The statistical analysis conducted on geographies consisting of 46,090,908 people shows a substantial positive correlation between the proportion of Immigrants from the Azores and poverty level among seniors over the age of 75 in the United States with a correlation coefficient (R) of 0.505 and weighted average of 15.2%. Similarly, the statistical analysis conducted on geographies consisting of 149,120,503 people shows a weak negative correlation between the proportion of Immigrants from Sri Lanka and poverty level among seniors over the age of 75 in the United States with a correlation coefficient (R) of -0.249 and weighted average of 11.5%, a difference of 32.2%.
Seniors Poverty Over the Age of 75 Correlation Summary
| Measurement | Immigrants from the Azores | Immigrants from Sri Lanka |
| Minimum | 0.91% | 1.8% |
| Maximum | 28.0% | 22.2% |
| Range | 27.1% | 20.4% |
| Mean | 13.6% | 10.2% |
| Median | 13.4% | 10.0% |
| Interquartile 25% (IQ1) | 10.5% | 7.4% |
| Interquartile 75% (IQ3) | 16.0% | 11.7% |
| Interquartile Range (IQR) | 5.5% | 4.3% |
| Standard Deviation (Sample) | 5.6% | 4.4% |
| Standard Deviation (Population) | 5.6% | 4.4% |
Similar Demographics by Seniors Poverty Over the Age of 75
Demographics Similar to Immigrants from the Azores by Seniors Poverty Over the Age of 75
In terms of seniors poverty over the age of 75, the demographic groups most similar to Immigrants from the Azores are Immigrants from Belize (15.2%, a difference of 0.020%), Paiute (15.2%, a difference of 0.020%), Colville (15.2%, a difference of 0.20%), Jamaican (15.1%, a difference of 0.28%), and Apache (15.3%, a difference of 0.60%).
| Demographics | Rating | Rank | Seniors Poverty Over the Age of 75 |
| Guatemalans | 0.0 /100 | #283 | Tragic 14.8% |
| Cheyenne | 0.0 /100 | #284 | Tragic 14.9% |
| Immigrants | Mexico | 0.0 /100 | #285 | Tragic 14.9% |
| Immigrants | Central America | 0.0 /100 | #286 | Tragic 15.0% |
| Immigrants | Guatemala | 0.0 /100 | #287 | Tragic 15.1% |
| Jamaicans | 0.0 /100 | #288 | Tragic 15.1% |
| Immigrants | Belize | 0.0 /100 | #289 | Tragic 15.2% |
| Immigrants | Azores | 0.0 /100 | #290 | Tragic 15.2% |
| Paiute | 0.0 /100 | #291 | Tragic 15.2% |
| Colville | 0.0 /100 | #292 | Tragic 15.2% |
| Apache | 0.0 /100 | #293 | Tragic 15.3% |
| Immigrants | Jamaica | 0.0 /100 | #294 | Tragic 15.3% |
| U.S. Virgin Islanders | 0.0 /100 | #295 | Tragic 15.4% |
| Yuman | 0.0 /100 | #296 | Tragic 15.4% |
| Hondurans | 0.0 /100 | #297 | Tragic 15.4% |
Demographics Similar to Immigrants from Sri Lanka by Seniors Poverty Over the Age of 75
In terms of seniors poverty over the age of 75, the demographic groups most similar to Immigrants from Sri Lanka are Immigrants from Croatia (11.5%, a difference of 0.030%), Korean (11.5%, a difference of 0.050%), Australian (11.5%, a difference of 0.080%), Immigrants from Bulgaria (11.5%, a difference of 0.10%), and Aleut (11.5%, a difference of 0.11%).
| Demographics | Rating | Rank | Seniors Poverty Over the Age of 75 |
| Iranians | 95.1 /100 | #82 | Exceptional 11.5% |
| Immigrants | South Africa | 94.9 /100 | #83 | Exceptional 11.5% |
| Immigrants | Iraq | 94.9 /100 | #84 | Exceptional 11.5% |
| Immigrants | Bulgaria | 94.7 /100 | #85 | Exceptional 11.5% |
| Australians | 94.6 /100 | #86 | Exceptional 11.5% |
| Koreans | 94.5 /100 | #87 | Exceptional 11.5% |
| Immigrants | Croatia | 94.5 /100 | #88 | Exceptional 11.5% |
| Immigrants | Sri Lanka | 94.4 /100 | #89 | Exceptional 11.5% |
| Aleuts | 94.1 /100 | #90 | Exceptional 11.5% |
| Immigrants | Germany | 94.1 /100 | #91 | Exceptional 11.5% |
| Kenyans | 93.9 /100 | #92 | Exceptional 11.5% |
| Immigrants | Poland | 92.9 /100 | #93 | Exceptional 11.6% |
| Creek | 92.7 /100 | #94 | Exceptional 11.6% |
| Immigrants | Bosnia and Herzegovina | 92.6 /100 | #95 | Exceptional 11.6% |
| Immigrants | Sweden | 92.6 /100 | #96 | Exceptional 11.6% |