Immigrants from Western Europe vs Latvian Female Poverty Among 18-24 Year Olds
COMPARE
Immigrants from Western Europe
Latvian
Female Poverty Among 18-24 Year Olds
Female Poverty Among 18-24 Year Olds Comparison
Immigrants from Western Europe
Latvians
20.6%
FEMALE POVERTY AMONG 18-24 YEAR OLDS
13.5/ 100
METRIC RATING
211th/ 347
METRIC RANK
19.5%
FEMALE POVERTY AMONG 18-24 YEAR OLDS
92.7/ 100
METRIC RATING
131st/ 347
METRIC RANK
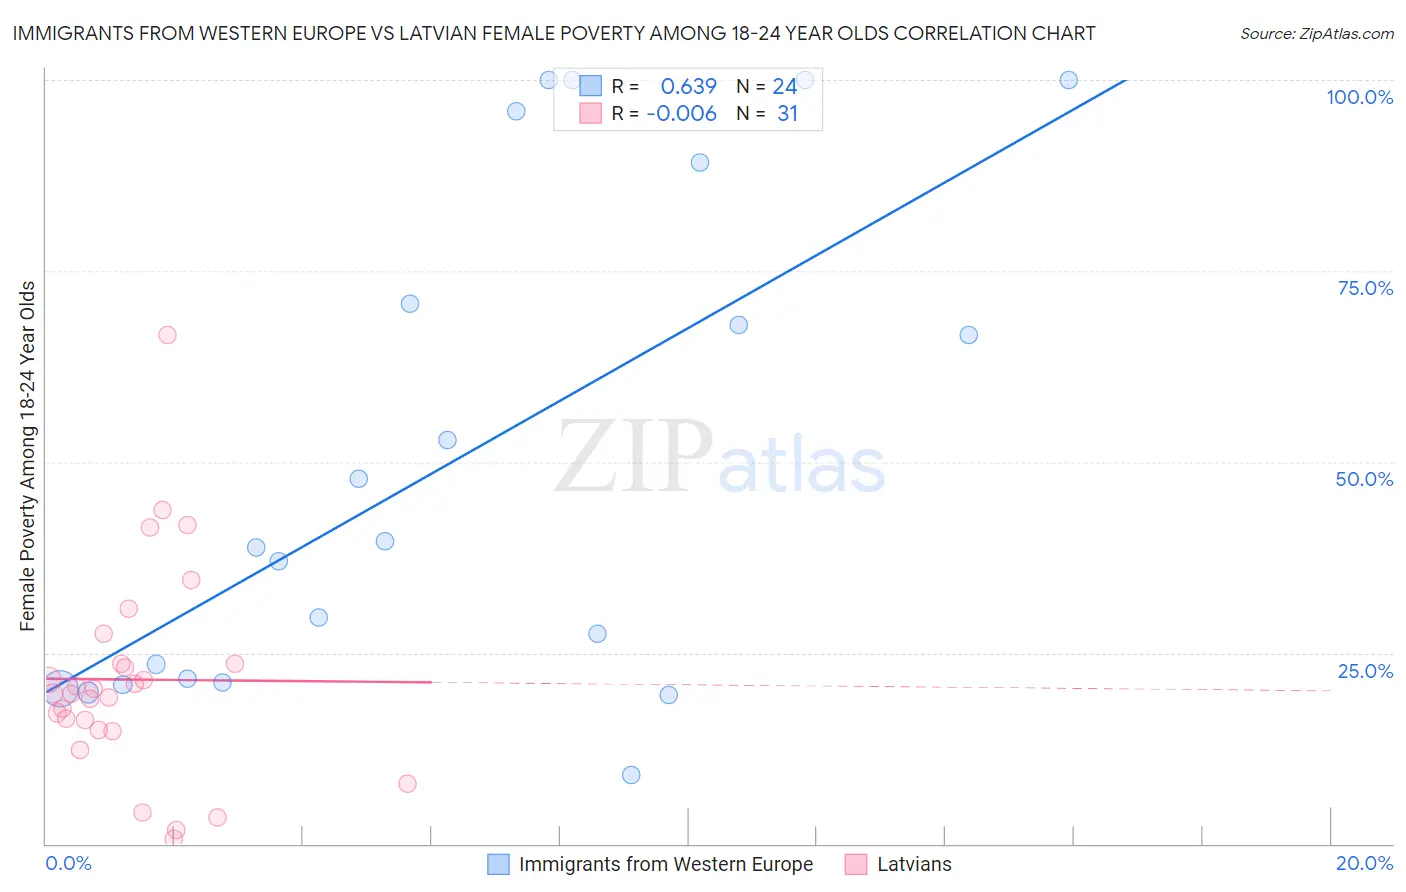
Immigrants from Western Europe vs Latvian Female Poverty Among 18-24 Year Olds Correlation Chart
The statistical analysis conducted on geographies consisting of 474,599,348 people shows a significant positive correlation between the proportion of Immigrants from Western Europe and poverty level among females between the ages 18 and 24 in the United States with a correlation coefficient (R) of 0.639 and weighted average of 20.6%. Similarly, the statistical analysis conducted on geographies consisting of 216,394,017 people shows no correlation between the proportion of Latvians and poverty level among females between the ages 18 and 24 in the United States with a correlation coefficient (R) of -0.006 and weighted average of 19.5%, a difference of 5.6%.
Female Poverty Among 18-24 Year Olds Correlation Summary
| Measurement | Immigrants from Western Europe | Latvian |
| Minimum | 8.9% | 0.67% |
| Maximum | 100.0% | 66.7% |
| Range | 91.1% | 66.0% |
| Mean | 50.8% | 21.5% |
| Median | 39.1% | 19.7% |
| Interquartile 25% (IQ1) | 21.3% | 15.0% |
| Interquartile 75% (IQ3) | 79.9% | 23.5% |
| Interquartile Range (IQR) | 58.6% | 8.6% |
| Standard Deviation (Sample) | 32.0% | 13.6% |
| Standard Deviation (Population) | 31.4% | 13.4% |
Similar Demographics by Female Poverty Among 18-24 Year Olds
Demographics Similar to Immigrants from Western Europe by Female Poverty Among 18-24 Year Olds
In terms of female poverty among 18-24 year olds, the demographic groups most similar to Immigrants from Western Europe are Immigrants from Ghana (20.5%, a difference of 0.080%), Arab (20.5%, a difference of 0.19%), Liberian (20.6%, a difference of 0.21%), Northern European (20.6%, a difference of 0.21%), and Dutch (20.5%, a difference of 0.22%).
| Demographics | Rating | Rank | Female Poverty Among 18-24 Year Olds |
| Immigrants | Netherlands | 17.0 /100 | #204 | Poor 20.5% |
| English | 16.7 /100 | #205 | Poor 20.5% |
| Hispanics or Latinos | 16.6 /100 | #206 | Poor 20.5% |
| Spaniards | 16.3 /100 | #207 | Poor 20.5% |
| Dutch | 15.9 /100 | #208 | Poor 20.5% |
| Arabs | 15.5 /100 | #209 | Poor 20.5% |
| Immigrants | Ghana | 14.3 /100 | #210 | Poor 20.5% |
| Immigrants | Western Europe | 13.5 /100 | #211 | Poor 20.6% |
| Liberians | 11.6 /100 | #212 | Poor 20.6% |
| Northern Europeans | 11.6 /100 | #213 | Poor 20.6% |
| Immigrants | South Africa | 10.7 /100 | #214 | Poor 20.6% |
| Spanish | 10.4 /100 | #215 | Poor 20.6% |
| Immigrants | Western Africa | 10.2 /100 | #216 | Poor 20.6% |
| Immigrants | Laos | 9.7 /100 | #217 | Tragic 20.6% |
| Immigrants | Nepal | 9.6 /100 | #218 | Tragic 20.7% |
Demographics Similar to Latvians by Female Poverty Among 18-24 Year Olds
In terms of female poverty among 18-24 year olds, the demographic groups most similar to Latvians are Slovak (19.5%, a difference of 0.040%), Immigrants from England (19.5%, a difference of 0.040%), Immigrants from Canada (19.5%, a difference of 0.040%), Jamaican (19.5%, a difference of 0.10%), and Turkish (19.5%, a difference of 0.11%).
| Demographics | Rating | Rank | Female Poverty Among 18-24 Year Olds |
| Immigrants | Chile | 94.3 /100 | #124 | Exceptional 19.4% |
| Immigrants | Panama | 94.0 /100 | #125 | Exceptional 19.4% |
| Immigrants | Russia | 93.7 /100 | #126 | Exceptional 19.4% |
| Cape Verdeans | 93.6 /100 | #127 | Exceptional 19.4% |
| Slovaks | 92.9 /100 | #128 | Exceptional 19.5% |
| Immigrants | England | 92.9 /100 | #129 | Exceptional 19.5% |
| Immigrants | Canada | 92.9 /100 | #130 | Exceptional 19.5% |
| Latvians | 92.7 /100 | #131 | Exceptional 19.5% |
| Jamaicans | 92.1 /100 | #132 | Exceptional 19.5% |
| Turks | 92.1 /100 | #133 | Exceptional 19.5% |
| Immigrants | North America | 92.1 /100 | #134 | Exceptional 19.5% |
| Soviet Union | 92.0 /100 | #135 | Exceptional 19.5% |
| Russians | 91.5 /100 | #136 | Exceptional 19.5% |
| Austrians | 90.7 /100 | #137 | Exceptional 19.5% |
| Immigrants | Morocco | 89.9 /100 | #138 | Excellent 19.6% |