Immigrants from Western Europe vs Welsh Female Poverty Among 18-24 Year Olds
COMPARE
Immigrants from Western Europe
Welsh
Female Poverty Among 18-24 Year Olds
Female Poverty Among 18-24 Year Olds Comparison
Immigrants from Western Europe
Welsh
20.6%
FEMALE POVERTY AMONG 18-24 YEAR OLDS
13.5/ 100
METRIC RATING
211th/ 347
METRIC RANK
20.8%
FEMALE POVERTY AMONG 18-24 YEAR OLDS
5.4/ 100
METRIC RATING
234th/ 347
METRIC RANK
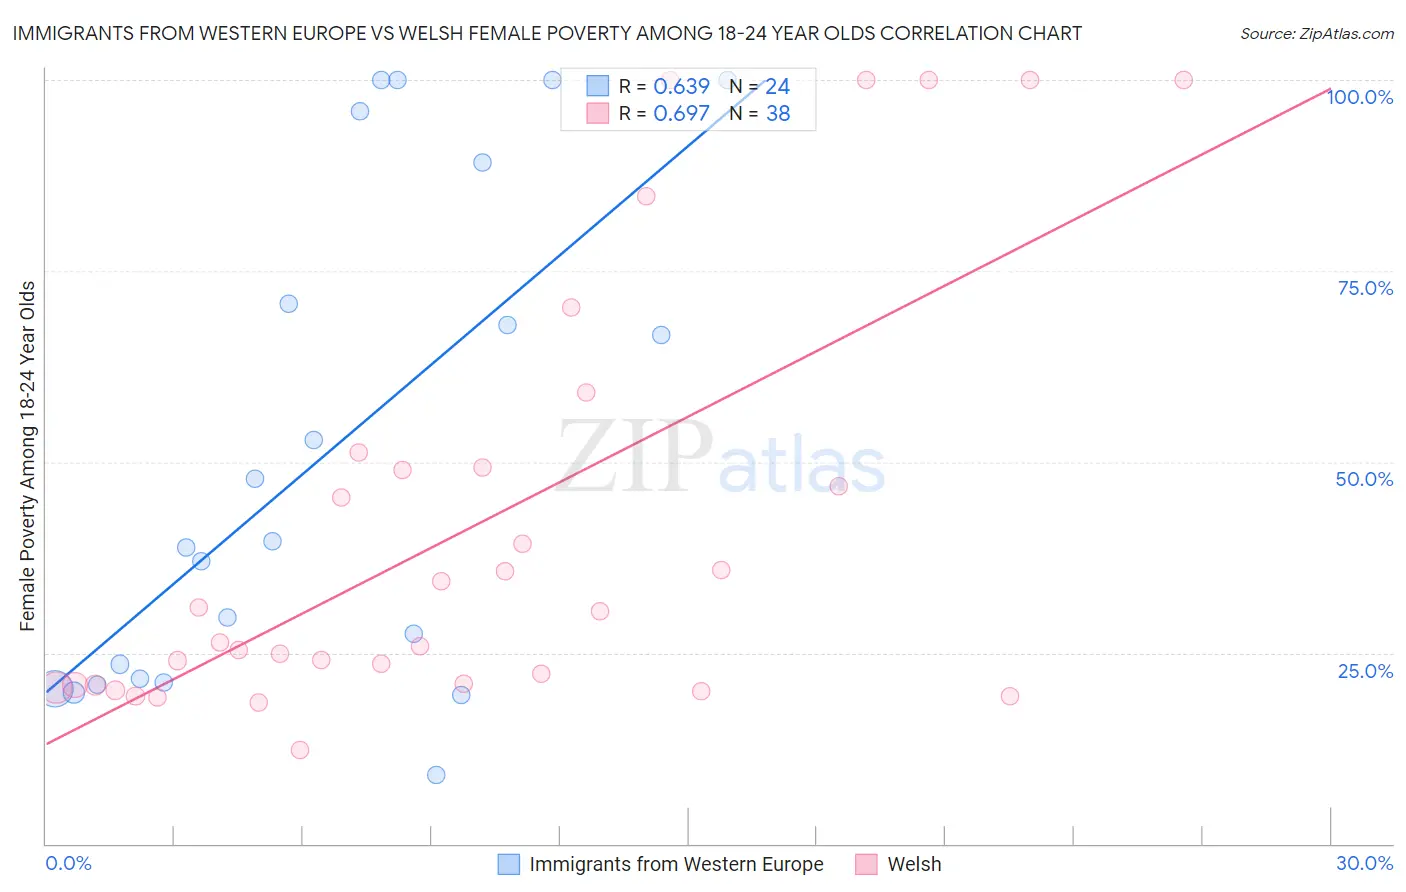
Immigrants from Western Europe vs Welsh Female Poverty Among 18-24 Year Olds Correlation Chart
The statistical analysis conducted on geographies consisting of 474,599,348 people shows a significant positive correlation between the proportion of Immigrants from Western Europe and poverty level among females between the ages 18 and 24 in the United States with a correlation coefficient (R) of 0.639 and weighted average of 20.6%. Similarly, the statistical analysis conducted on geographies consisting of 502,174,037 people shows a significant positive correlation between the proportion of Welsh and poverty level among females between the ages 18 and 24 in the United States with a correlation coefficient (R) of 0.697 and weighted average of 20.8%, a difference of 1.2%.
Female Poverty Among 18-24 Year Olds Correlation Summary
| Measurement | Immigrants from Western Europe | Welsh |
| Minimum | 8.9% | 12.3% |
| Maximum | 100.0% | 100.0% |
| Range | 91.1% | 87.7% |
| Mean | 50.8% | 41.3% |
| Median | 39.1% | 28.4% |
| Interquartile 25% (IQ1) | 21.3% | 20.8% |
| Interquartile 75% (IQ3) | 79.9% | 49.2% |
| Interquartile Range (IQR) | 58.6% | 28.4% |
| Standard Deviation (Sample) | 32.0% | 27.8% |
| Standard Deviation (Population) | 31.4% | 27.4% |
Similar Demographics by Female Poverty Among 18-24 Year Olds
Demographics Similar to Immigrants from Western Europe by Female Poverty Among 18-24 Year Olds
In terms of female poverty among 18-24 year olds, the demographic groups most similar to Immigrants from Western Europe are Immigrants from Ghana (20.5%, a difference of 0.080%), Arab (20.5%, a difference of 0.19%), Liberian (20.6%, a difference of 0.21%), Northern European (20.6%, a difference of 0.21%), and Dutch (20.5%, a difference of 0.22%).
| Demographics | Rating | Rank | Female Poverty Among 18-24 Year Olds |
| Immigrants | Netherlands | 17.0 /100 | #204 | Poor 20.5% |
| English | 16.7 /100 | #205 | Poor 20.5% |
| Hispanics or Latinos | 16.6 /100 | #206 | Poor 20.5% |
| Spaniards | 16.3 /100 | #207 | Poor 20.5% |
| Dutch | 15.9 /100 | #208 | Poor 20.5% |
| Arabs | 15.5 /100 | #209 | Poor 20.5% |
| Immigrants | Ghana | 14.3 /100 | #210 | Poor 20.5% |
| Immigrants | Western Europe | 13.5 /100 | #211 | Poor 20.6% |
| Liberians | 11.6 /100 | #212 | Poor 20.6% |
| Northern Europeans | 11.6 /100 | #213 | Poor 20.6% |
| Immigrants | South Africa | 10.7 /100 | #214 | Poor 20.6% |
| Spanish | 10.4 /100 | #215 | Poor 20.6% |
| Immigrants | Western Africa | 10.2 /100 | #216 | Poor 20.6% |
| Immigrants | Laos | 9.7 /100 | #217 | Tragic 20.6% |
| Immigrants | Nepal | 9.6 /100 | #218 | Tragic 20.7% |
Demographics Similar to Welsh by Female Poverty Among 18-24 Year Olds
In terms of female poverty among 18-24 year olds, the demographic groups most similar to Welsh are Immigrants from Uganda (20.8%, a difference of 0.080%), Immigrants from Denmark (20.8%, a difference of 0.10%), Finnish (20.8%, a difference of 0.13%), Okinawan (20.8%, a difference of 0.13%), and Immigrants from St. Vincent and the Grenadines (20.8%, a difference of 0.14%).
| Demographics | Rating | Rank | Female Poverty Among 18-24 Year Olds |
| Immigrants | Sweden | 6.8 /100 | #227 | Tragic 20.7% |
| Ghanaians | 6.5 /100 | #228 | Tragic 20.8% |
| Australians | 6.1 /100 | #229 | Tragic 20.8% |
| Whites/Caucasians | 6.1 /100 | #230 | Tragic 20.8% |
| Immigrants | St. Vincent and the Grenadines | 6.0 /100 | #231 | Tragic 20.8% |
| Finns | 6.0 /100 | #232 | Tragic 20.8% |
| Immigrants | Denmark | 5.8 /100 | #233 | Tragic 20.8% |
| Welsh | 5.4 /100 | #234 | Tragic 20.8% |
| Immigrants | Uganda | 5.1 /100 | #235 | Tragic 20.8% |
| Okinawans | 4.9 /100 | #236 | Tragic 20.8% |
| Scottish | 4.5 /100 | #237 | Tragic 20.9% |
| Immigrants | Singapore | 4.4 /100 | #238 | Tragic 20.9% |
| Immigrants | Guatemala | 4.3 /100 | #239 | Tragic 20.9% |
| Luxembourgers | 4.2 /100 | #240 | Tragic 20.9% |
| Immigrants | Eritrea | 4.2 /100 | #241 | Tragic 20.9% |