Immigrants from Western Africa vs French Canadian Seniors Poverty Over the Age of 65
COMPARE
Immigrants from Western Africa
French Canadian
Seniors Poverty Over the Age of 65
Seniors Poverty Over the Age of 65 Comparison
Immigrants from Western Africa
French Canadians
12.6%
SENIORS POVERTY OVER THE AGE OF 65
0.1/ 100
METRIC RATING
265th/ 347
METRIC RANK
9.8%
SENIORS POVERTY OVER THE AGE OF 65
98.9/ 100
METRIC RATING
62nd/ 347
METRIC RANK
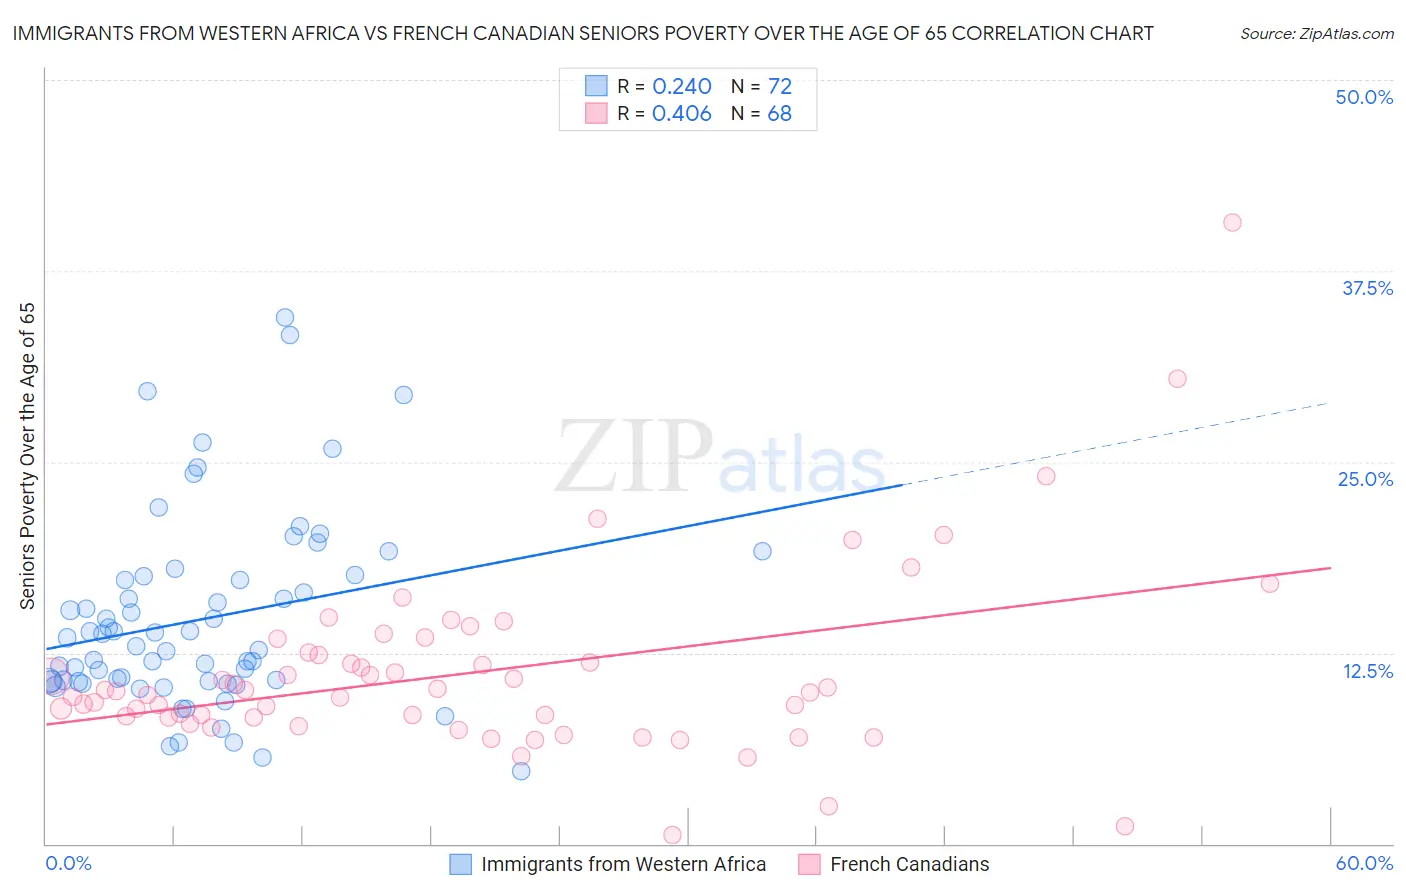
Immigrants from Western Africa vs French Canadian Seniors Poverty Over the Age of 65 Correlation Chart
The statistical analysis conducted on geographies consisting of 356,449,715 people shows a weak positive correlation between the proportion of Immigrants from Western Africa and poverty level among seniors over the age of 65 in the United States with a correlation coefficient (R) of 0.240 and weighted average of 12.6%. Similarly, the statistical analysis conducted on geographies consisting of 499,603,433 people shows a moderate positive correlation between the proportion of French Canadians and poverty level among seniors over the age of 65 in the United States with a correlation coefficient (R) of 0.406 and weighted average of 9.8%, a difference of 27.8%.
Seniors Poverty Over the Age of 65 Correlation Summary
| Measurement | Immigrants from Western Africa | French Canadian |
| Minimum | 4.8% | 0.55% |
| Maximum | 34.4% | 40.7% |
| Range | 29.7% | 40.2% |
| Mean | 14.7% | 11.2% |
| Median | 13.2% | 9.9% |
| Interquartile 25% (IQ1) | 10.6% | 8.3% |
| Interquartile 75% (IQ3) | 17.4% | 12.5% |
| Interquartile Range (IQR) | 6.8% | 4.2% |
| Standard Deviation (Sample) | 6.3% | 6.1% |
| Standard Deviation (Population) | 6.2% | 6.0% |
Similar Demographics by Seniors Poverty Over the Age of 65
Demographics Similar to Immigrants from Western Africa by Seniors Poverty Over the Age of 65
In terms of seniors poverty over the age of 65, the demographic groups most similar to Immigrants from Western Africa are Inupiat (12.6%, a difference of 0.090%), Soviet Union (12.6%, a difference of 0.16%), African (12.6%, a difference of 0.17%), Blackfeet (12.6%, a difference of 0.31%), and Venezuelan (12.5%, a difference of 0.32%).
| Demographics | Rating | Rank | Seniors Poverty Over the Age of 65 |
| Dutch West Indians | 0.2 /100 | #258 | Tragic 12.4% |
| Ghanaians | 0.2 /100 | #259 | Tragic 12.4% |
| South Americans | 0.2 /100 | #260 | Tragic 12.5% |
| Colombians | 0.2 /100 | #261 | Tragic 12.5% |
| Venezuelans | 0.1 /100 | #262 | Tragic 12.5% |
| Soviet Union | 0.1 /100 | #263 | Tragic 12.6% |
| Inupiat | 0.1 /100 | #264 | Tragic 12.6% |
| Immigrants | Western Africa | 0.1 /100 | #265 | Tragic 12.6% |
| Africans | 0.1 /100 | #266 | Tragic 12.6% |
| Blackfeet | 0.1 /100 | #267 | Tragic 12.6% |
| Immigrants | Somalia | 0.1 /100 | #268 | Tragic 12.6% |
| Immigrants | Venezuela | 0.1 /100 | #269 | Tragic 12.7% |
| Immigrants | South America | 0.1 /100 | #270 | Tragic 12.7% |
| Immigrants | Ghana | 0.1 /100 | #271 | Tragic 12.8% |
| Immigrants | Uruguay | 0.1 /100 | #272 | Tragic 12.8% |
Demographics Similar to French Canadians by Seniors Poverty Over the Age of 65
In terms of seniors poverty over the age of 65, the demographic groups most similar to French Canadians are Iranian (9.8%, a difference of 0.040%), Celtic (9.8%, a difference of 0.13%), Immigrants from Canada (9.8%, a difference of 0.16%), Macedonian (9.9%, a difference of 0.18%), and Immigrants from North America (9.9%, a difference of 0.23%).
| Demographics | Rating | Rank | Seniors Poverty Over the Age of 65 |
| Afghans | 99.2 /100 | #55 | Exceptional 9.8% |
| Immigrants | England | 99.1 /100 | #56 | Exceptional 9.8% |
| Bolivians | 99.1 /100 | #57 | Exceptional 9.8% |
| Serbians | 99.1 /100 | #58 | Exceptional 9.8% |
| Immigrants | Canada | 99.0 /100 | #59 | Exceptional 9.8% |
| Celtics | 99.0 /100 | #60 | Exceptional 9.8% |
| Iranians | 98.9 /100 | #61 | Exceptional 9.8% |
| French Canadians | 98.9 /100 | #62 | Exceptional 9.8% |
| Macedonians | 98.8 /100 | #63 | Exceptional 9.9% |
| Immigrants | North America | 98.8 /100 | #64 | Exceptional 9.9% |
| Pennsylvania Germans | 98.7 /100 | #65 | Exceptional 9.9% |
| Immigrants | Netherlands | 98.7 /100 | #66 | Exceptional 9.9% |
| Immigrants | Austria | 98.6 /100 | #67 | Exceptional 9.9% |
| Canadians | 98.5 /100 | #68 | Exceptional 9.9% |
| Australians | 98.4 /100 | #69 | Exceptional 9.9% |