Immigrants from Guatemala vs French Canadian Seniors Poverty Over the Age of 65
COMPARE
Immigrants from Guatemala
French Canadian
Seniors Poverty Over the Age of 65
Seniors Poverty Over the Age of 65 Comparison
Immigrants from Guatemala
French Canadians
13.8%
SENIORS POVERTY OVER THE AGE OF 65
0.0/ 100
METRIC RATING
293rd/ 347
METRIC RANK
9.8%
SENIORS POVERTY OVER THE AGE OF 65
98.9/ 100
METRIC RATING
62nd/ 347
METRIC RANK
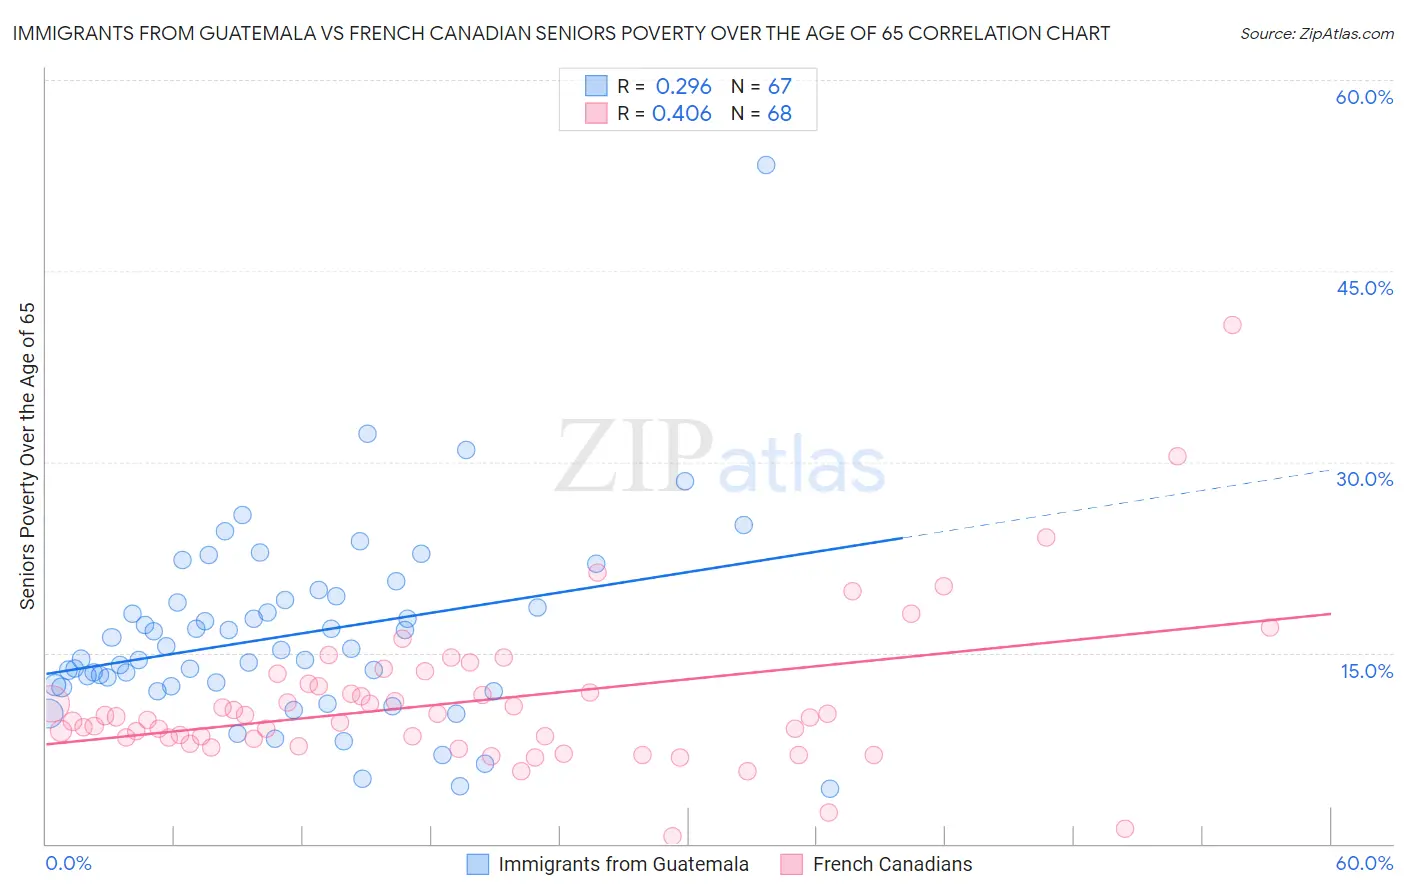
Immigrants from Guatemala vs French Canadian Seniors Poverty Over the Age of 65 Correlation Chart
The statistical analysis conducted on geographies consisting of 376,570,340 people shows a weak positive correlation between the proportion of Immigrants from Guatemala and poverty level among seniors over the age of 65 in the United States with a correlation coefficient (R) of 0.296 and weighted average of 13.8%. Similarly, the statistical analysis conducted on geographies consisting of 499,603,433 people shows a moderate positive correlation between the proportion of French Canadians and poverty level among seniors over the age of 65 in the United States with a correlation coefficient (R) of 0.406 and weighted average of 9.8%, a difference of 40.6%.
Seniors Poverty Over the Age of 65 Correlation Summary
| Measurement | Immigrants from Guatemala | French Canadian |
| Minimum | 4.3% | 0.55% |
| Maximum | 53.3% | 40.7% |
| Range | 49.0% | 40.2% |
| Mean | 16.4% | 11.2% |
| Median | 15.2% | 9.9% |
| Interquartile 25% (IQ1) | 12.4% | 8.3% |
| Interquartile 75% (IQ3) | 19.1% | 12.5% |
| Interquartile Range (IQR) | 6.7% | 4.2% |
| Standard Deviation (Sample) | 7.5% | 6.1% |
| Standard Deviation (Population) | 7.4% | 6.0% |
Similar Demographics by Seniors Poverty Over the Age of 65
Demographics Similar to Immigrants from Guatemala by Seniors Poverty Over the Age of 65
In terms of seniors poverty over the age of 65, the demographic groups most similar to Immigrants from Guatemala are Spanish American Indian (13.8%, a difference of 0.19%), Cheyenne (13.9%, a difference of 0.42%), Apache (13.9%, a difference of 0.61%), Black/African American (13.7%, a difference of 0.88%), and Immigrants from Jamaica (13.9%, a difference of 0.88%).
| Demographics | Rating | Rank | Seniors Poverty Over the Age of 65 |
| Immigrants | Senegal | 0.0 /100 | #286 | Tragic 13.6% |
| Immigrants | Mexico | 0.0 /100 | #287 | Tragic 13.6% |
| Belizeans | 0.0 /100 | #288 | Tragic 13.6% |
| Jamaicans | 0.0 /100 | #289 | Tragic 13.6% |
| Immigrants | Central America | 0.0 /100 | #290 | Tragic 13.6% |
| Blacks/African Americans | 0.0 /100 | #291 | Tragic 13.7% |
| Spanish American Indians | 0.0 /100 | #292 | Tragic 13.8% |
| Immigrants | Guatemala | 0.0 /100 | #293 | Tragic 13.8% |
| Cheyenne | 0.0 /100 | #294 | Tragic 13.9% |
| Apache | 0.0 /100 | #295 | Tragic 13.9% |
| Immigrants | Jamaica | 0.0 /100 | #296 | Tragic 13.9% |
| Vietnamese | 0.0 /100 | #297 | Tragic 14.0% |
| Immigrants | Belize | 0.0 /100 | #298 | Tragic 14.0% |
| Ecuadorians | 0.0 /100 | #299 | Tragic 14.0% |
| Immigrants | Uzbekistan | 0.0 /100 | #300 | Tragic 14.0% |
Demographics Similar to French Canadians by Seniors Poverty Over the Age of 65
In terms of seniors poverty over the age of 65, the demographic groups most similar to French Canadians are Iranian (9.8%, a difference of 0.040%), Celtic (9.8%, a difference of 0.13%), Immigrants from Canada (9.8%, a difference of 0.16%), Macedonian (9.9%, a difference of 0.18%), and Immigrants from North America (9.9%, a difference of 0.23%).
| Demographics | Rating | Rank | Seniors Poverty Over the Age of 65 |
| Afghans | 99.2 /100 | #55 | Exceptional 9.8% |
| Immigrants | England | 99.1 /100 | #56 | Exceptional 9.8% |
| Bolivians | 99.1 /100 | #57 | Exceptional 9.8% |
| Serbians | 99.1 /100 | #58 | Exceptional 9.8% |
| Immigrants | Canada | 99.0 /100 | #59 | Exceptional 9.8% |
| Celtics | 99.0 /100 | #60 | Exceptional 9.8% |
| Iranians | 98.9 /100 | #61 | Exceptional 9.8% |
| French Canadians | 98.9 /100 | #62 | Exceptional 9.8% |
| Macedonians | 98.8 /100 | #63 | Exceptional 9.9% |
| Immigrants | North America | 98.8 /100 | #64 | Exceptional 9.9% |
| Pennsylvania Germans | 98.7 /100 | #65 | Exceptional 9.9% |
| Immigrants | Netherlands | 98.7 /100 | #66 | Exceptional 9.9% |
| Immigrants | Austria | 98.6 /100 | #67 | Exceptional 9.9% |
| Canadians | 98.5 /100 | #68 | Exceptional 9.9% |
| Australians | 98.4 /100 | #69 | Exceptional 9.9% |