Immigrants from West Indies vs Bulgarian Child Poverty Under the Age of 5
COMPARE
Immigrants from West Indies
Bulgarian
Child Poverty Under the Age of 5
Child Poverty Under the Age of 5 Comparison
Immigrants from West Indies
Bulgarians
20.7%
CHILD POVERTY UNDER THE AGE OF 5
0.0/ 100
METRIC RATING
277th/ 347
METRIC RANK
13.9%
CHILD POVERTY UNDER THE AGE OF 5
99.9/ 100
METRIC RATING
23rd/ 347
METRIC RANK
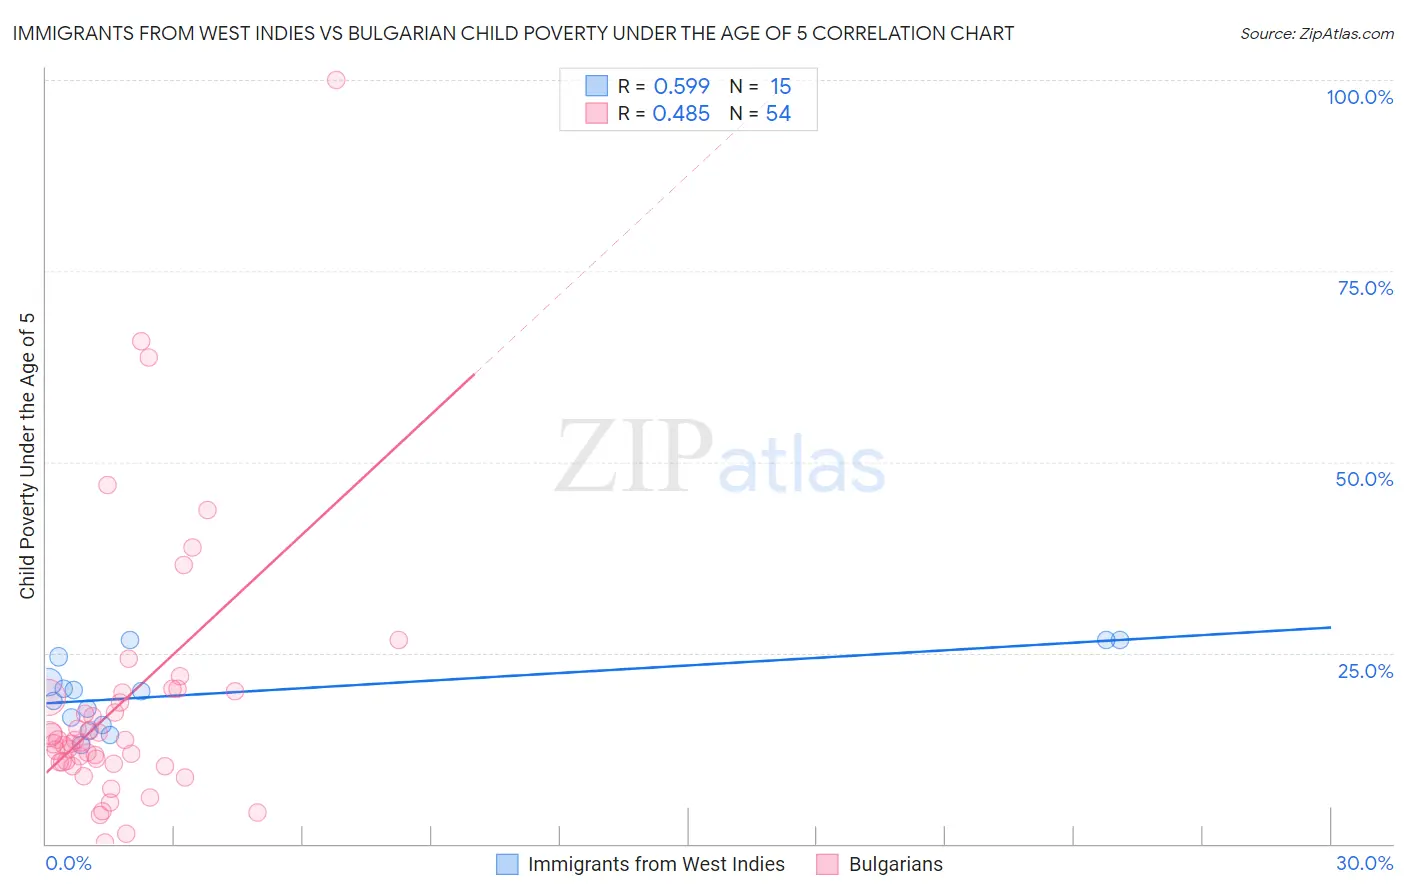
Immigrants from West Indies vs Bulgarian Child Poverty Under the Age of 5 Correlation Chart
The statistical analysis conducted on geographies consisting of 71,916,924 people shows a substantial positive correlation between the proportion of Immigrants from West Indies and poverty level among children under the age of 5 in the United States with a correlation coefficient (R) of 0.599 and weighted average of 20.7%. Similarly, the statistical analysis conducted on geographies consisting of 199,600,281 people shows a moderate positive correlation between the proportion of Bulgarians and poverty level among children under the age of 5 in the United States with a correlation coefficient (R) of 0.485 and weighted average of 13.9%, a difference of 48.8%.
Child Poverty Under the Age of 5 Correlation Summary
| Measurement | Immigrants from West Indies | Bulgarian |
| Minimum | 12.9% | 0.17% |
| Maximum | 26.7% | 100.0% |
| Range | 13.8% | 99.8% |
| Mean | 19.8% | 18.5% |
| Median | 20.0% | 13.4% |
| Interquartile 25% (IQ1) | 15.5% | 10.7% |
| Interquartile 75% (IQ3) | 24.5% | 19.8% |
| Interquartile Range (IQR) | 8.9% | 9.1% |
| Standard Deviation (Sample) | 4.7% | 17.4% |
| Standard Deviation (Population) | 4.5% | 17.3% |
Similar Demographics by Child Poverty Under the Age of 5
Demographics Similar to Immigrants from West Indies by Child Poverty Under the Age of 5
In terms of child poverty under the age of 5, the demographic groups most similar to Immigrants from West Indies are Immigrants from Grenada (20.7%, a difference of 0.020%), West Indian (20.6%, a difference of 0.17%), Bangladeshi (20.6%, a difference of 0.26%), Immigrants from Belize (20.6%, a difference of 0.31%), and Subsaharan African (20.8%, a difference of 0.39%).
| Demographics | Rating | Rank | Child Poverty Under the Age of 5 |
| Jamaicans | 0.1 /100 | #270 | Tragic 20.4% |
| Americans | 0.1 /100 | #271 | Tragic 20.5% |
| Immigrants | Jamaica | 0.1 /100 | #272 | Tragic 20.5% |
| Central Americans | 0.1 /100 | #273 | Tragic 20.6% |
| Immigrants | Belize | 0.1 /100 | #274 | Tragic 20.6% |
| Bangladeshis | 0.1 /100 | #275 | Tragic 20.6% |
| West Indians | 0.0 /100 | #276 | Tragic 20.6% |
| Immigrants | West Indies | 0.0 /100 | #277 | Tragic 20.7% |
| Immigrants | Grenada | 0.0 /100 | #278 | Tragic 20.7% |
| Sub-Saharan Africans | 0.0 /100 | #279 | Tragic 20.8% |
| French American Indians | 0.0 /100 | #280 | Tragic 20.8% |
| Senegalese | 0.0 /100 | #281 | Tragic 20.9% |
| Potawatomi | 0.0 /100 | #282 | Tragic 21.0% |
| Comanche | 0.0 /100 | #283 | Tragic 21.0% |
| Somalis | 0.0 /100 | #284 | Tragic 21.1% |
Demographics Similar to Bulgarians by Child Poverty Under the Age of 5
In terms of child poverty under the age of 5, the demographic groups most similar to Bulgarians are Immigrants from Bolivia (13.8%, a difference of 0.44%), Asian (14.0%, a difference of 0.51%), Bolivian (13.8%, a difference of 0.52%), Cypriot (14.0%, a difference of 0.52%), and Immigrants from Japan (13.8%, a difference of 0.82%).
| Demographics | Rating | Rank | Child Poverty Under the Age of 5 |
| Immigrants | Eastern Asia | 100.0 /100 | #16 | Exceptional 13.5% |
| Assyrians/Chaldeans/Syriacs | 100.0 /100 | #17 | Exceptional 13.6% |
| Immigrants | China | 100.0 /100 | #18 | Exceptional 13.6% |
| Immigrants | Ireland | 100.0 /100 | #19 | Exceptional 13.7% |
| Immigrants | Japan | 100.0 /100 | #20 | Exceptional 13.8% |
| Bolivians | 100.0 /100 | #21 | Exceptional 13.8% |
| Immigrants | Bolivia | 100.0 /100 | #22 | Exceptional 13.8% |
| Bulgarians | 99.9 /100 | #23 | Exceptional 13.9% |
| Asians | 99.9 /100 | #24 | Exceptional 14.0% |
| Cypriots | 99.9 /100 | #25 | Exceptional 14.0% |
| Immigrants | Lithuania | 99.9 /100 | #26 | Exceptional 14.1% |
| Tongans | 99.9 /100 | #27 | Exceptional 14.2% |
| Immigrants | Indonesia | 99.8 /100 | #28 | Exceptional 14.3% |
| Immigrants | Asia | 99.8 /100 | #29 | Exceptional 14.4% |
| Cambodians | 99.8 /100 | #30 | Exceptional 14.4% |