Immigrants from Trinidad and Tobago vs Okinawan Child Poverty Under the Age of 5
COMPARE
Immigrants from Trinidad and Tobago
Okinawan
Child Poverty Under the Age of 5
Child Poverty Under the Age of 5 Comparison
Immigrants from Trinidad and Tobago
Okinawans
19.4%
CHILD POVERTY UNDER THE AGE OF 5
0.8/ 100
METRIC RATING
236th/ 347
METRIC RANK
13.4%
CHILD POVERTY UNDER THE AGE OF 5
100.0/ 100
METRIC RATING
14th/ 347
METRIC RANK
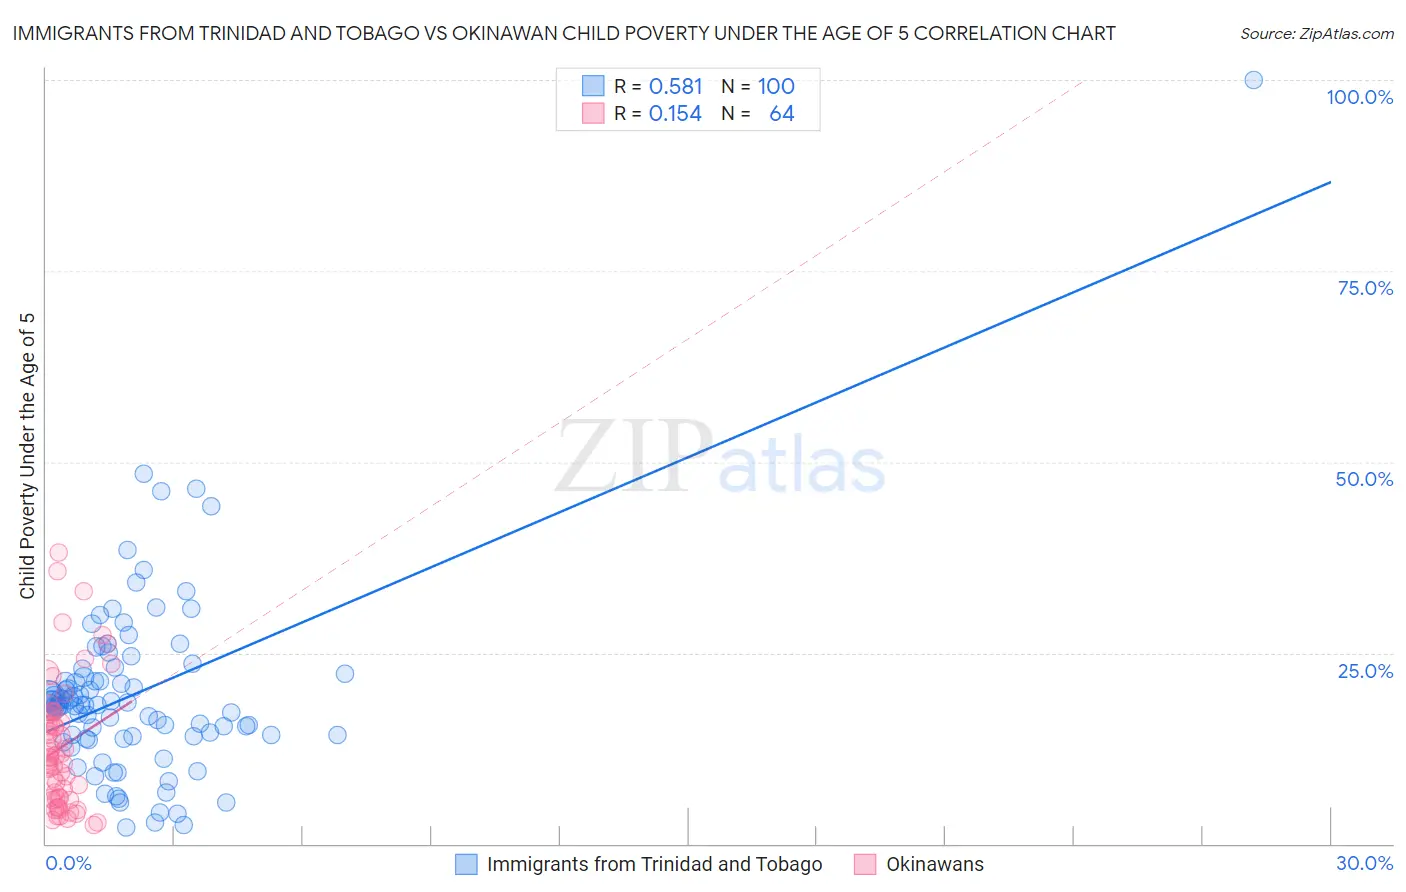
Immigrants from Trinidad and Tobago vs Okinawan Child Poverty Under the Age of 5 Correlation Chart
The statistical analysis conducted on geographies consisting of 218,090,061 people shows a substantial positive correlation between the proportion of Immigrants from Trinidad and Tobago and poverty level among children under the age of 5 in the United States with a correlation coefficient (R) of 0.581 and weighted average of 19.4%. Similarly, the statistical analysis conducted on geographies consisting of 72,437,494 people shows a poor positive correlation between the proportion of Okinawans and poverty level among children under the age of 5 in the United States with a correlation coefficient (R) of 0.154 and weighted average of 13.4%, a difference of 44.3%.
Child Poverty Under the Age of 5 Correlation Summary
| Measurement | Immigrants from Trinidad and Tobago | Okinawan |
| Minimum | 2.2% | 2.5% |
| Maximum | 100.0% | 38.1% |
| Range | 97.8% | 35.6% |
| Mean | 19.7% | 12.6% |
| Median | 18.1% | 11.1% |
| Interquartile 25% (IQ1) | 14.1% | 5.9% |
| Interquartile 75% (IQ3) | 22.6% | 16.4% |
| Interquartile Range (IQR) | 8.5% | 10.5% |
| Standard Deviation (Sample) | 12.4% | 8.4% |
| Standard Deviation (Population) | 12.3% | 8.3% |
Similar Demographics by Child Poverty Under the Age of 5
Demographics Similar to Immigrants from Trinidad and Tobago by Child Poverty Under the Age of 5
In terms of child poverty under the age of 5, the demographic groups most similar to Immigrants from Trinidad and Tobago are Immigrants from Laos (19.4%, a difference of 0.0%), Immigrants from Micronesia (19.4%, a difference of 0.21%), Sudanese (19.3%, a difference of 0.34%), Trinidadian and Tobagonian (19.3%, a difference of 0.39%), and Immigrants from Cabo Verde (19.5%, a difference of 0.55%).
| Demographics | Rating | Rank | Child Poverty Under the Age of 5 |
| Ghanaians | 1.2 /100 | #229 | Tragic 19.2% |
| Ecuadorians | 1.2 /100 | #230 | Tragic 19.2% |
| Bermudans | 1.2 /100 | #231 | Tragic 19.2% |
| Trinidadians and Tobagonians | 0.9 /100 | #232 | Tragic 19.3% |
| Sudanese | 0.9 /100 | #233 | Tragic 19.3% |
| Immigrants | Micronesia | 0.9 /100 | #234 | Tragic 19.4% |
| Immigrants | Laos | 0.8 /100 | #235 | Tragic 19.4% |
| Immigrants | Trinidad and Tobago | 0.8 /100 | #236 | Tragic 19.4% |
| Immigrants | Cabo Verde | 0.6 /100 | #237 | Tragic 19.5% |
| Salvadorans | 0.6 /100 | #238 | Tragic 19.5% |
| Vietnamese | 0.6 /100 | #239 | Tragic 19.5% |
| Immigrants | Ecuador | 0.5 /100 | #240 | Tragic 19.6% |
| Alaska Natives | 0.5 /100 | #241 | Tragic 19.6% |
| Immigrants | Guyana | 0.5 /100 | #242 | Tragic 19.6% |
| Osage | 0.5 /100 | #243 | Tragic 19.6% |
Demographics Similar to Okinawans by Child Poverty Under the Age of 5
In terms of child poverty under the age of 5, the demographic groups most similar to Okinawans are Indian (Asian) (13.4%, a difference of 0.050%), Immigrants from Eastern Asia (13.5%, a difference of 0.57%), Bhutanese (13.4%, a difference of 0.65%), Assyrian/Chaldean/Syriac (13.6%, a difference of 0.91%), and Immigrants from China (13.6%, a difference of 1.2%).
| Demographics | Rating | Rank | Child Poverty Under the Age of 5 |
| Chinese | 100.0 /100 | #7 | Exceptional 13.1% |
| Iranians | 100.0 /100 | #8 | Exceptional 13.1% |
| Immigrants | Iran | 100.0 /100 | #9 | Exceptional 13.1% |
| Burmese | 100.0 /100 | #10 | Exceptional 13.2% |
| Immigrants | Korea | 100.0 /100 | #11 | Exceptional 13.2% |
| Immigrants | South Central Asia | 100.0 /100 | #12 | Exceptional 13.3% |
| Bhutanese | 100.0 /100 | #13 | Exceptional 13.4% |
| Okinawans | 100.0 /100 | #14 | Exceptional 13.4% |
| Indians (Asian) | 100.0 /100 | #15 | Exceptional 13.4% |
| Immigrants | Eastern Asia | 100.0 /100 | #16 | Exceptional 13.5% |
| Assyrians/Chaldeans/Syriacs | 100.0 /100 | #17 | Exceptional 13.6% |
| Immigrants | China | 100.0 /100 | #18 | Exceptional 13.6% |
| Immigrants | Ireland | 100.0 /100 | #19 | Exceptional 13.7% |
| Immigrants | Japan | 100.0 /100 | #20 | Exceptional 13.8% |
| Bolivians | 100.0 /100 | #21 | Exceptional 13.8% |