Immigrants from Trinidad and Tobago vs Immigrants from Peru Family Poverty
COMPARE
Immigrants from Trinidad and Tobago
Immigrants from Peru
Family Poverty
Family Poverty Comparison
Immigrants from Trinidad and Tobago
Immigrants from Peru
10.9%
FAMILY POVERTY
0.1/ 100
METRIC RATING
265th/ 347
METRIC RANK
8.9%
FAMILY POVERTY
57.5/ 100
METRIC RATING
172nd/ 347
METRIC RANK
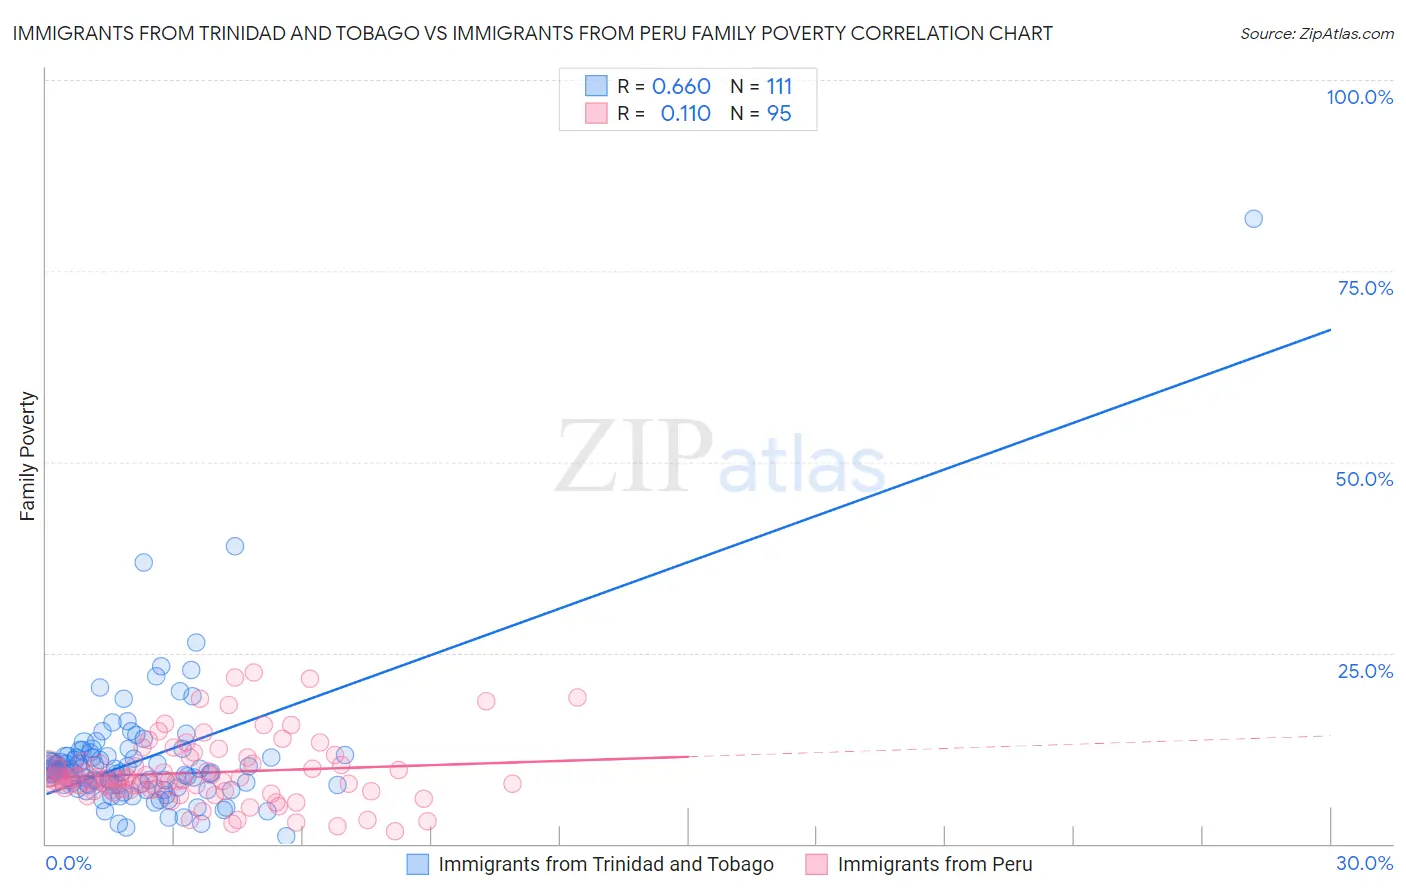
Immigrants from Trinidad and Tobago vs Immigrants from Peru Family Poverty Correlation Chart
The statistical analysis conducted on geographies consisting of 223,249,707 people shows a significant positive correlation between the proportion of Immigrants from Trinidad and Tobago and poverty level among families in the United States with a correlation coefficient (R) of 0.660 and weighted average of 10.9%. Similarly, the statistical analysis conducted on geographies consisting of 328,434,488 people shows a poor positive correlation between the proportion of Immigrants from Peru and poverty level among families in the United States with a correlation coefficient (R) of 0.110 and weighted average of 8.9%, a difference of 22.8%.
Family Poverty Correlation Summary
| Measurement | Immigrants from Trinidad and Tobago | Immigrants from Peru |
| Minimum | 1.1% | 1.6% |
| Maximum | 81.8% | 22.5% |
| Range | 80.8% | 20.8% |
| Mean | 11.1% | 9.3% |
| Median | 9.4% | 8.5% |
| Interquartile 25% (IQ1) | 7.6% | 7.0% |
| Interquartile 75% (IQ3) | 11.5% | 10.8% |
| Interquartile Range (IQR) | 3.9% | 3.8% |
| Standard Deviation (Sample) | 8.9% | 4.3% |
| Standard Deviation (Population) | 8.9% | 4.3% |
Similar Demographics by Family Poverty
Demographics Similar to Immigrants from Trinidad and Tobago by Family Poverty
In terms of family poverty, the demographic groups most similar to Immigrants from Trinidad and Tobago are Trinidadian and Tobagonian (10.9%, a difference of 0.060%), Cape Verdean (10.9%, a difference of 0.070%), Spanish American Indian (10.9%, a difference of 0.33%), Shoshone (10.9%, a difference of 0.46%), and Bangladeshi (10.9%, a difference of 0.50%).
| Demographics | Rating | Rank | Family Poverty |
| Sub-Saharan Africans | 0.2 /100 | #258 | Tragic 10.9% |
| Mexican American Indians | 0.2 /100 | #259 | Tragic 10.9% |
| Bangladeshis | 0.2 /100 | #260 | Tragic 10.9% |
| Shoshone | 0.2 /100 | #261 | Tragic 10.9% |
| Spanish American Indians | 0.2 /100 | #262 | Tragic 10.9% |
| Cape Verdeans | 0.1 /100 | #263 | Tragic 10.9% |
| Trinidadians and Tobagonians | 0.1 /100 | #264 | Tragic 10.9% |
| Immigrants | Trinidad and Tobago | 0.1 /100 | #265 | Tragic 10.9% |
| Immigrants | El Salvador | 0.1 /100 | #266 | Tragic 11.0% |
| Comanche | 0.1 /100 | #267 | Tragic 11.0% |
| Jamaicans | 0.1 /100 | #268 | Tragic 11.1% |
| Immigrants | Ecuador | 0.1 /100 | #269 | Tragic 11.1% |
| Immigrants | Nicaragua | 0.1 /100 | #270 | Tragic 11.1% |
| Immigrants | Bahamas | 0.1 /100 | #271 | Tragic 11.1% |
| Immigrants | Jamaica | 0.1 /100 | #272 | Tragic 11.2% |
Demographics Similar to Immigrants from Peru by Family Poverty
In terms of family poverty, the demographic groups most similar to Immigrants from Peru are Lebanese (8.9%, a difference of 0.010%), Kenyan (8.9%, a difference of 0.090%), Immigrants from Fiji (8.9%, a difference of 0.15%), Immigrants from Chile (8.9%, a difference of 0.29%), and Israeli (8.9%, a difference of 0.63%).
| Demographics | Rating | Rank | Family Poverty |
| Guamanians/Chamorros | 64.7 /100 | #165 | Good 8.8% |
| Afghans | 63.5 /100 | #166 | Good 8.8% |
| Immigrants | Ethiopia | 62.5 /100 | #167 | Good 8.9% |
| Israelis | 62.1 /100 | #168 | Good 8.9% |
| Immigrants | Chile | 59.6 /100 | #169 | Average 8.9% |
| Kenyans | 58.2 /100 | #170 | Average 8.9% |
| Lebanese | 57.6 /100 | #171 | Average 8.9% |
| Immigrants | Peru | 57.5 /100 | #172 | Average 8.9% |
| Immigrants | Fiji | 56.4 /100 | #173 | Average 8.9% |
| Immigrants | Albania | 50.0 /100 | #174 | Average 9.0% |
| Costa Ricans | 49.3 /100 | #175 | Average 9.0% |
| Immigrants | Syria | 47.5 /100 | #176 | Average 9.0% |
| Hawaiians | 47.2 /100 | #177 | Average 9.0% |
| Immigrants | Cameroon | 47.1 /100 | #178 | Average 9.0% |
| Immigrants | Iraq | 44.4 /100 | #179 | Average 9.1% |