Immigrants from Switzerland vs Navajo Child Poverty Under the Age of 16
COMPARE
Immigrants from Switzerland
Navajo
Child Poverty Under the Age of 16
Child Poverty Under the Age of 16 Comparison
Immigrants from Switzerland
Navajo
14.8%
CHILD POVERTY UNDER THE AGE OF 16
95.1/ 100
METRIC RATING
101st/ 347
METRIC RANK
30.2%
CHILD POVERTY UNDER THE AGE OF 16
0.0/ 100
METRIC RATING
344th/ 347
METRIC RANK
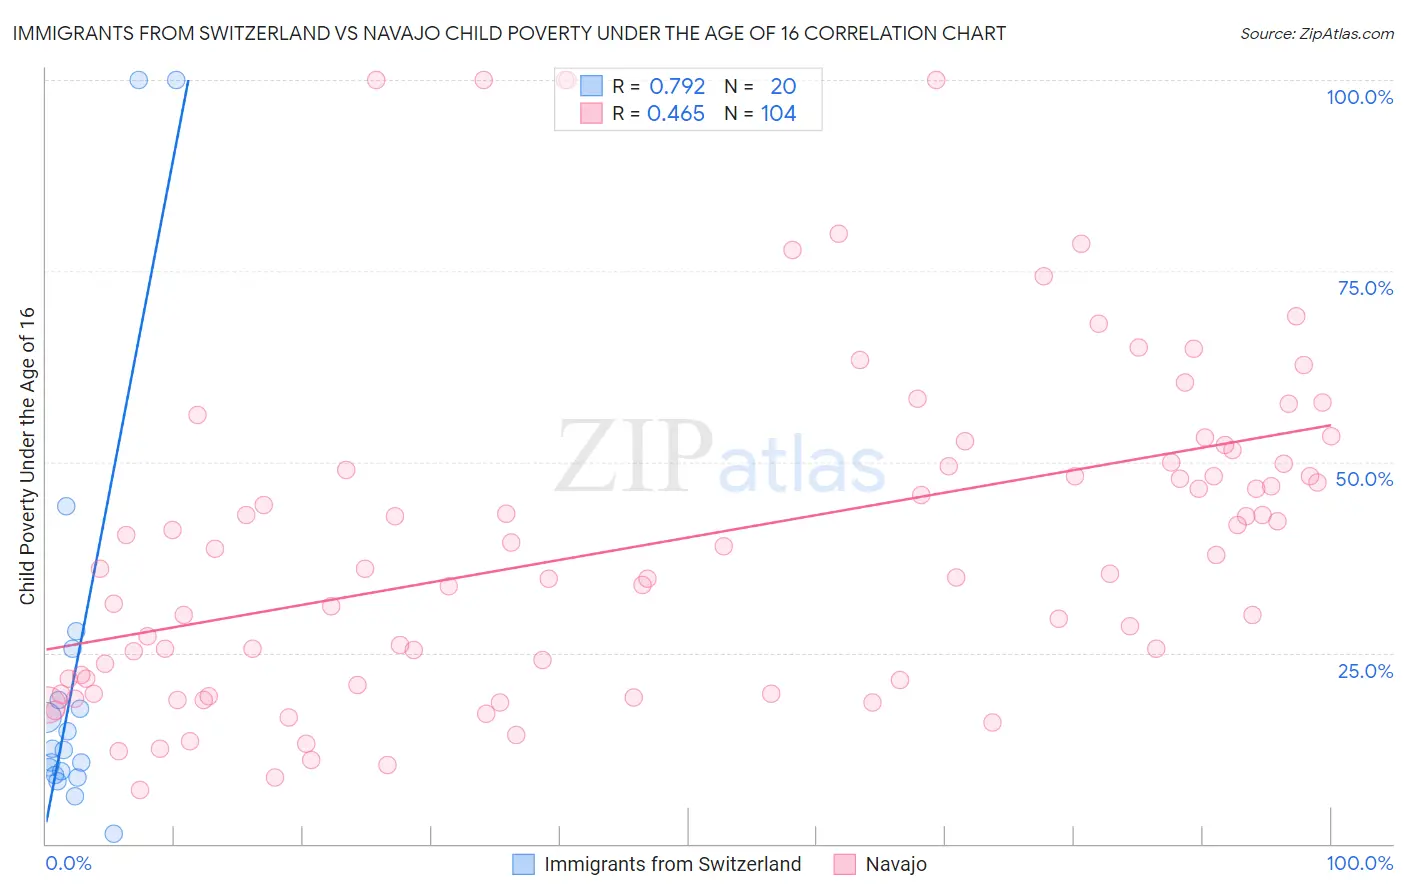
Immigrants from Switzerland vs Navajo Child Poverty Under the Age of 16 Correlation Chart
The statistical analysis conducted on geographies consisting of 147,239,417 people shows a strong positive correlation between the proportion of Immigrants from Switzerland and poverty level among children under the age of 16 in the United States with a correlation coefficient (R) of 0.792 and weighted average of 14.8%. Similarly, the statistical analysis conducted on geographies consisting of 224,099,770 people shows a moderate positive correlation between the proportion of Navajo and poverty level among children under the age of 16 in the United States with a correlation coefficient (R) of 0.465 and weighted average of 30.2%, a difference of 104.7%.
Child Poverty Under the Age of 16 Correlation Summary
| Measurement | Immigrants from Switzerland | Navajo |
| Minimum | 1.3% | 7.1% |
| Maximum | 100.0% | 100.0% |
| Range | 98.7% | 92.9% |
| Mean | 23.2% | 39.7% |
| Median | 12.4% | 36.9% |
| Interquartile 25% (IQ1) | 9.3% | 21.5% |
| Interquartile 75% (IQ3) | 22.1% | 49.9% |
| Interquartile Range (IQR) | 12.9% | 28.4% |
| Standard Deviation (Sample) | 27.9% | 22.0% |
| Standard Deviation (Population) | 27.2% | 21.9% |
Similar Demographics by Child Poverty Under the Age of 16
Demographics Similar to Immigrants from Switzerland by Child Poverty Under the Age of 16
In terms of child poverty under the age of 16, the demographic groups most similar to Immigrants from Switzerland are Dutch (14.8%, a difference of 0.010%), Romanian (14.8%, a difference of 0.070%), Immigrants from Egypt (14.8%, a difference of 0.11%), Immigrants from England (14.8%, a difference of 0.16%), and Basque (14.8%, a difference of 0.27%).
| Demographics | Rating | Rank | Child Poverty Under the Age of 16 |
| Immigrants | South Africa | 96.3 /100 | #94 | Exceptional 14.6% |
| Immigrants | Croatia | 96.1 /100 | #95 | Exceptional 14.6% |
| Immigrants | France | 95.8 /100 | #96 | Exceptional 14.7% |
| Paraguayans | 95.7 /100 | #97 | Exceptional 14.7% |
| Immigrants | Belarus | 95.7 /100 | #98 | Exceptional 14.7% |
| British | 95.5 /100 | #99 | Exceptional 14.7% |
| Dutch | 95.1 /100 | #100 | Exceptional 14.8% |
| Immigrants | Switzerland | 95.1 /100 | #101 | Exceptional 14.8% |
| Romanians | 95.0 /100 | #102 | Exceptional 14.8% |
| Immigrants | Egypt | 94.9 /100 | #103 | Exceptional 14.8% |
| Immigrants | England | 94.8 /100 | #104 | Exceptional 14.8% |
| Basques | 94.7 /100 | #105 | Exceptional 14.8% |
| Serbians | 94.5 /100 | #106 | Exceptional 14.8% |
| Chileans | 94.4 /100 | #107 | Exceptional 14.8% |
| Jordanians | 94.2 /100 | #108 | Exceptional 14.8% |
Demographics Similar to Navajo by Child Poverty Under the Age of 16
In terms of child poverty under the age of 16, the demographic groups most similar to Navajo are Lumbee (31.0%, a difference of 2.5%), Immigrants from Yemen (29.1%, a difference of 4.0%), Pima (29.0%, a difference of 4.2%), Yuman (28.9%, a difference of 4.4%), and Tohono O'odham (31.7%, a difference of 4.9%).
| Demographics | Rating | Rank | Child Poverty Under the Age of 16 |
| Immigrants | Dominican Republic | 0.0 /100 | #333 | Tragic 24.0% |
| Blacks/African Americans | 0.0 /100 | #334 | Tragic 24.4% |
| Houma | 0.0 /100 | #335 | Tragic 24.9% |
| Yup'ik | 0.0 /100 | #336 | Tragic 25.1% |
| Sioux | 0.0 /100 | #337 | Tragic 25.2% |
| Cheyenne | 0.0 /100 | #338 | Tragic 25.4% |
| Crow | 0.0 /100 | #339 | Tragic 26.0% |
| Hopi | 0.0 /100 | #340 | Tragic 27.1% |
| Yuman | 0.0 /100 | #341 | Tragic 28.9% |
| Pima | 0.0 /100 | #342 | Tragic 29.0% |
| Immigrants | Yemen | 0.0 /100 | #343 | Tragic 29.1% |
| Navajo | 0.0 /100 | #344 | Tragic 30.2% |
| Lumbee | 0.0 /100 | #345 | Tragic 31.0% |
| Tohono O'odham | 0.0 /100 | #346 | Tragic 31.7% |
| Puerto Ricans | 0.0 /100 | #347 | Tragic 32.5% |