Immigrants from Sudan vs Immigrants from Somalia Female Poverty Among 25-34 Year Olds
COMPARE
Immigrants from Sudan
Immigrants from Somalia
Female Poverty Among 25-34 Year Olds
Female Poverty Among 25-34 Year Olds Comparison
Immigrants from Sudan
Immigrants from Somalia
14.4%
FEMALE POVERTY AMONG 25-34 YEAR OLDS
4.0/ 100
METRIC RATING
224th/ 347
METRIC RANK
15.4%
FEMALE POVERTY AMONG 25-34 YEAR OLDS
0.1/ 100
METRIC RATING
266th/ 347
METRIC RANK
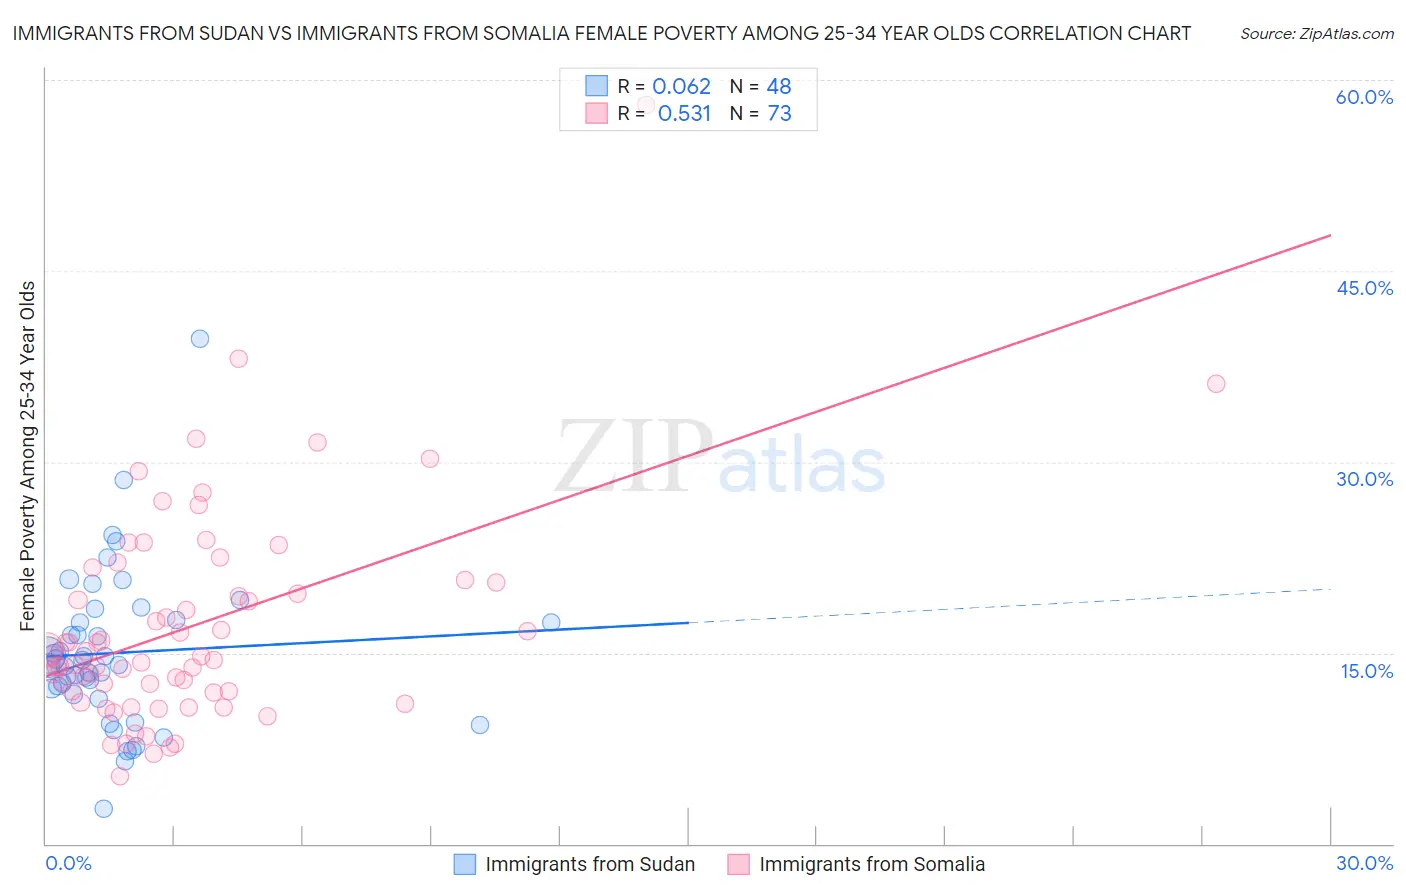
Immigrants from Sudan vs Immigrants from Somalia Female Poverty Among 25-34 Year Olds Correlation Chart
The statistical analysis conducted on geographies consisting of 118,579,963 people shows a slight positive correlation between the proportion of Immigrants from Sudan and poverty level among females between the ages 25 and 34 in the United States with a correlation coefficient (R) of 0.062 and weighted average of 14.4%. Similarly, the statistical analysis conducted on geographies consisting of 91,786,624 people shows a substantial positive correlation between the proportion of Immigrants from Somalia and poverty level among females between the ages 25 and 34 in the United States with a correlation coefficient (R) of 0.531 and weighted average of 15.4%, a difference of 7.0%.
Female Poverty Among 25-34 Year Olds Correlation Summary
| Measurement | Immigrants from Sudan | Immigrants from Somalia |
| Minimum | 2.8% | 5.3% |
| Maximum | 39.6% | 58.1% |
| Range | 36.9% | 52.7% |
| Mean | 15.0% | 17.1% |
| Median | 14.3% | 14.7% |
| Interquartile 25% (IQ1) | 12.0% | 11.9% |
| Interquartile 75% (IQ3) | 17.5% | 20.6% |
| Interquartile Range (IQR) | 5.5% | 8.7% |
| Standard Deviation (Sample) | 6.2% | 8.5% |
| Standard Deviation (Population) | 6.1% | 8.5% |
Similar Demographics by Female Poverty Among 25-34 Year Olds
Demographics Similar to Immigrants from Sudan by Female Poverty Among 25-34 Year Olds
In terms of female poverty among 25-34 year olds, the demographic groups most similar to Immigrants from Sudan are Nigerian (14.4%, a difference of 0.070%), Immigrants from Portugal (14.4%, a difference of 0.13%), Sudanese (14.4%, a difference of 0.20%), Immigrants from Barbados (14.5%, a difference of 0.32%), and Ghanaian (14.4%, a difference of 0.36%).
| Demographics | Rating | Rank | Female Poverty Among 25-34 Year Olds |
| Spanish American Indians | 5.5 /100 | #217 | Tragic 14.3% |
| Immigrants | Thailand | 5.2 /100 | #218 | Tragic 14.3% |
| Ecuadorians | 5.2 /100 | #219 | Tragic 14.3% |
| Ghanaians | 4.8 /100 | #220 | Tragic 14.4% |
| Sudanese | 4.4 /100 | #221 | Tragic 14.4% |
| Immigrants | Portugal | 4.3 /100 | #222 | Tragic 14.4% |
| Nigerians | 4.2 /100 | #223 | Tragic 14.4% |
| Immigrants | Sudan | 4.0 /100 | #224 | Tragic 14.4% |
| Immigrants | Barbados | 3.4 /100 | #225 | Tragic 14.5% |
| Nicaraguans | 3.3 /100 | #226 | Tragic 14.5% |
| Celtics | 2.8 /100 | #227 | Tragic 14.5% |
| Vietnamese | 2.6 /100 | #228 | Tragic 14.6% |
| Spanish | 2.5 /100 | #229 | Tragic 14.6% |
| Spaniards | 2.3 /100 | #230 | Tragic 14.6% |
| Delaware | 2.3 /100 | #231 | Tragic 14.6% |
Demographics Similar to Immigrants from Somalia by Female Poverty Among 25-34 Year Olds
In terms of female poverty among 25-34 year olds, the demographic groups most similar to Immigrants from Somalia are Immigrants from Liberia (15.4%, a difference of 0.010%), Pennsylvania German (15.4%, a difference of 0.040%), Central American (15.5%, a difference of 0.38%), Mexican American Indian (15.4%, a difference of 0.48%), and Immigrants from Belize (15.3%, a difference of 0.72%).
| Demographics | Rating | Rank | Female Poverty Among 25-34 Year Olds |
| Immigrants | Cuba | 0.2 /100 | #259 | Tragic 15.2% |
| Marshallese | 0.2 /100 | #260 | Tragic 15.3% |
| Liberians | 0.2 /100 | #261 | Tragic 15.3% |
| Immigrants | Belize | 0.2 /100 | #262 | Tragic 15.3% |
| Mexican American Indians | 0.2 /100 | #263 | Tragic 15.4% |
| Pennsylvania Germans | 0.1 /100 | #264 | Tragic 15.4% |
| Immigrants | Liberia | 0.1 /100 | #265 | Tragic 15.4% |
| Immigrants | Somalia | 0.1 /100 | #266 | Tragic 15.4% |
| Central Americans | 0.1 /100 | #267 | Tragic 15.5% |
| Immigrants | Senegal | 0.1 /100 | #268 | Tragic 15.6% |
| Sub-Saharan Africans | 0.1 /100 | #269 | Tragic 15.6% |
| British West Indians | 0.1 /100 | #270 | Tragic 15.6% |
| Cree | 0.1 /100 | #271 | Tragic 15.6% |
| Senegalese | 0.1 /100 | #272 | Tragic 15.6% |
| Immigrants | Nonimmigrants | 0.1 /100 | #273 | Tragic 15.6% |