Greek vs Immigrants from Somalia Female Poverty Among 25-34 Year Olds
COMPARE
Greek
Immigrants from Somalia
Female Poverty Among 25-34 Year Olds
Female Poverty Among 25-34 Year Olds Comparison
Greeks
Immigrants from Somalia
12.3%
FEMALE POVERTY AMONG 25-34 YEAR OLDS
98.9/ 100
METRIC RATING
76th/ 347
METRIC RANK
15.4%
FEMALE POVERTY AMONG 25-34 YEAR OLDS
0.1/ 100
METRIC RATING
266th/ 347
METRIC RANK
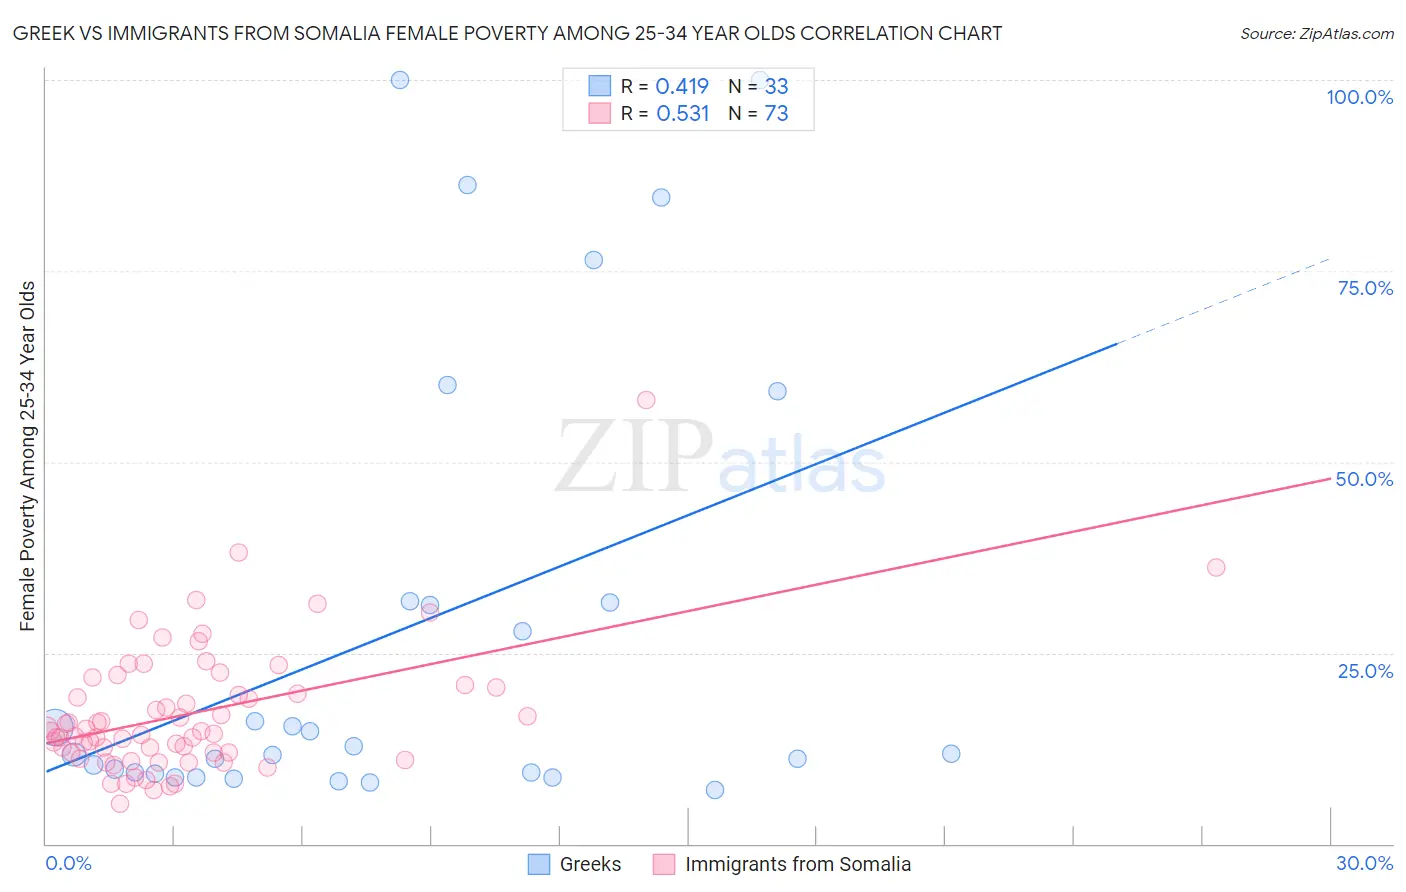
Greek vs Immigrants from Somalia Female Poverty Among 25-34 Year Olds Correlation Chart
The statistical analysis conducted on geographies consisting of 470,128,205 people shows a moderate positive correlation between the proportion of Greeks and poverty level among females between the ages 25 and 34 in the United States with a correlation coefficient (R) of 0.419 and weighted average of 12.3%. Similarly, the statistical analysis conducted on geographies consisting of 91,786,624 people shows a substantial positive correlation between the proportion of Immigrants from Somalia and poverty level among females between the ages 25 and 34 in the United States with a correlation coefficient (R) of 0.531 and weighted average of 15.4%, a difference of 25.6%.
Female Poverty Among 25-34 Year Olds Correlation Summary
| Measurement | Greek | Immigrants from Somalia |
| Minimum | 7.0% | 5.3% |
| Maximum | 100.0% | 58.1% |
| Range | 93.0% | 52.7% |
| Mean | 28.1% | 17.1% |
| Median | 11.8% | 14.7% |
| Interquartile 25% (IQ1) | 9.2% | 11.9% |
| Interquartile 75% (IQ3) | 31.6% | 20.6% |
| Interquartile Range (IQR) | 22.4% | 8.7% |
| Standard Deviation (Sample) | 29.6% | 8.5% |
| Standard Deviation (Population) | 29.1% | 8.5% |
Similar Demographics by Female Poverty Among 25-34 Year Olds
Demographics Similar to Greeks by Female Poverty Among 25-34 Year Olds
In terms of female poverty among 25-34 year olds, the demographic groups most similar to Greeks are Estonian (12.3%, a difference of 0.060%), Immigrants from Sweden (12.3%, a difference of 0.11%), Immigrants from Vietnam (12.3%, a difference of 0.14%), Immigrants from Italy (12.3%, a difference of 0.16%), and Immigrants from Ukraine (12.3%, a difference of 0.39%).
| Demographics | Rating | Rank | Female Poverty Among 25-34 Year Olds |
| Immigrants | Lebanon | 99.1 /100 | #69 | Exceptional 12.2% |
| Immigrants | Belgium | 99.1 /100 | #70 | Exceptional 12.2% |
| Immigrants | Scotland | 99.1 /100 | #71 | Exceptional 12.2% |
| Lithuanians | 99.1 /100 | #72 | Exceptional 12.2% |
| Immigrants | Vietnam | 98.9 /100 | #73 | Exceptional 12.3% |
| Immigrants | Sweden | 98.9 /100 | #74 | Exceptional 12.3% |
| Estonians | 98.9 /100 | #75 | Exceptional 12.3% |
| Greeks | 98.9 /100 | #76 | Exceptional 12.3% |
| Immigrants | Italy | 98.8 /100 | #77 | Exceptional 12.3% |
| Immigrants | Ukraine | 98.6 /100 | #78 | Exceptional 12.3% |
| Immigrants | Jordan | 98.5 /100 | #79 | Exceptional 12.4% |
| Immigrants | Malaysia | 98.3 /100 | #80 | Exceptional 12.4% |
| Immigrants | Kazakhstan | 98.1 /100 | #81 | Exceptional 12.4% |
| Ethiopians | 98.0 /100 | #82 | Exceptional 12.4% |
| Albanians | 97.7 /100 | #83 | Exceptional 12.5% |
Demographics Similar to Immigrants from Somalia by Female Poverty Among 25-34 Year Olds
In terms of female poverty among 25-34 year olds, the demographic groups most similar to Immigrants from Somalia are Immigrants from Liberia (15.4%, a difference of 0.010%), Pennsylvania German (15.4%, a difference of 0.040%), Central American (15.5%, a difference of 0.38%), Mexican American Indian (15.4%, a difference of 0.48%), and Immigrants from Belize (15.3%, a difference of 0.72%).
| Demographics | Rating | Rank | Female Poverty Among 25-34 Year Olds |
| Immigrants | Cuba | 0.2 /100 | #259 | Tragic 15.2% |
| Marshallese | 0.2 /100 | #260 | Tragic 15.3% |
| Liberians | 0.2 /100 | #261 | Tragic 15.3% |
| Immigrants | Belize | 0.2 /100 | #262 | Tragic 15.3% |
| Mexican American Indians | 0.2 /100 | #263 | Tragic 15.4% |
| Pennsylvania Germans | 0.1 /100 | #264 | Tragic 15.4% |
| Immigrants | Liberia | 0.1 /100 | #265 | Tragic 15.4% |
| Immigrants | Somalia | 0.1 /100 | #266 | Tragic 15.4% |
| Central Americans | 0.1 /100 | #267 | Tragic 15.5% |
| Immigrants | Senegal | 0.1 /100 | #268 | Tragic 15.6% |
| Sub-Saharan Africans | 0.1 /100 | #269 | Tragic 15.6% |
| British West Indians | 0.1 /100 | #270 | Tragic 15.6% |
| Cree | 0.1 /100 | #271 | Tragic 15.6% |
| Senegalese | 0.1 /100 | #272 | Tragic 15.6% |
| Immigrants | Nonimmigrants | 0.1 /100 | #273 | Tragic 15.6% |