Immigrants from Sudan vs Immigrants from Netherlands Female Poverty Among 25-34 Year Olds
COMPARE
Immigrants from Sudan
Immigrants from Netherlands
Female Poverty Among 25-34 Year Olds
Female Poverty Among 25-34 Year Olds Comparison
Immigrants from Sudan
Immigrants from Netherlands
14.4%
FEMALE POVERTY AMONG 25-34 YEAR OLDS
4.0/ 100
METRIC RATING
224th/ 347
METRIC RANK
12.8%
FEMALE POVERTY AMONG 25-34 YEAR OLDS
92.0/ 100
METRIC RATING
124th/ 347
METRIC RANK
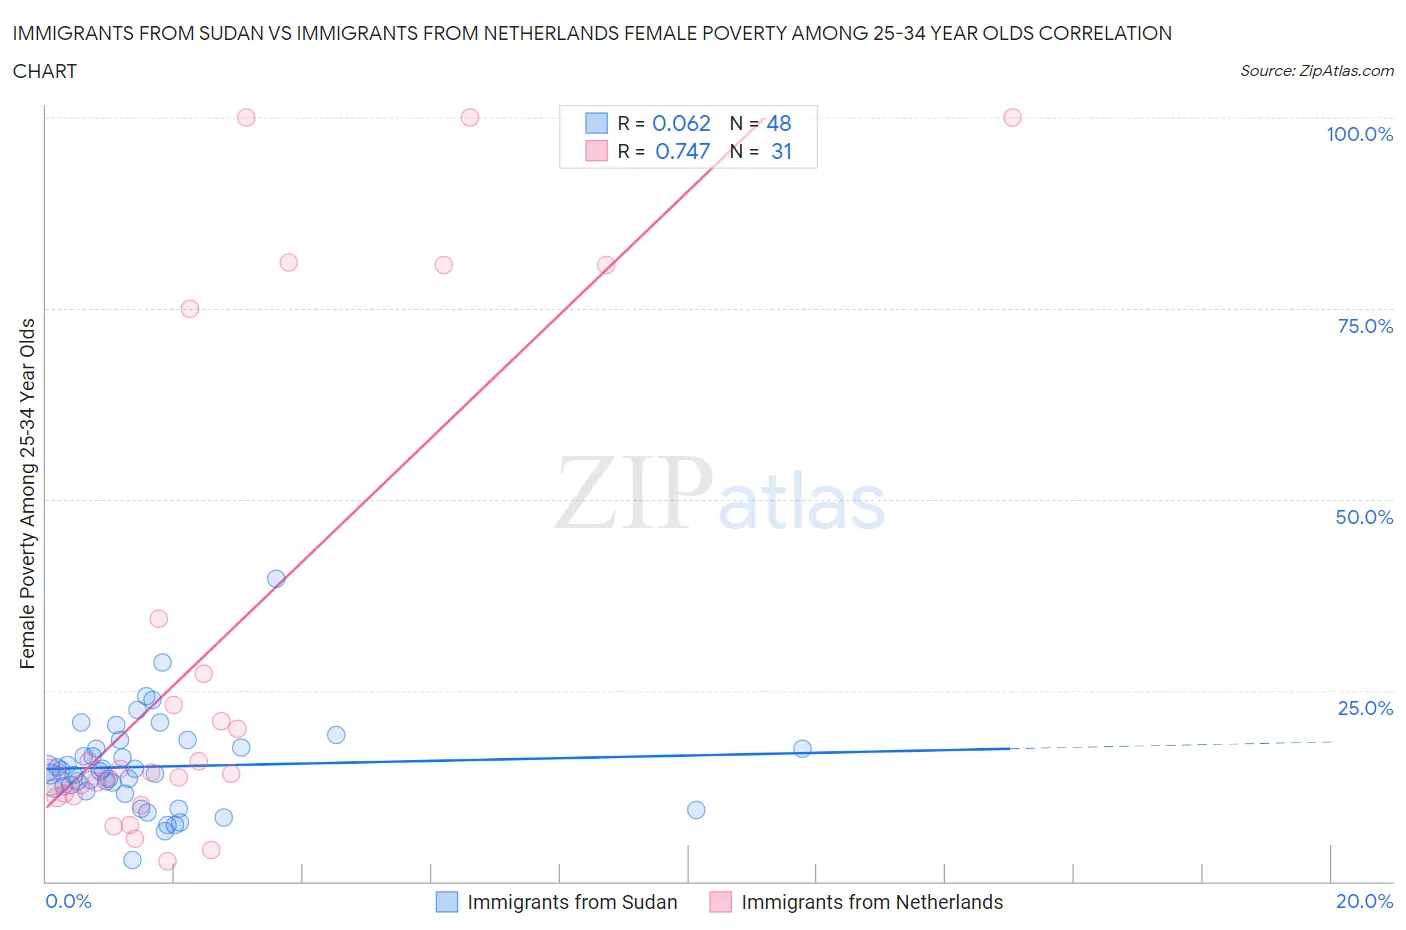
Immigrants from Sudan vs Immigrants from Netherlands Female Poverty Among 25-34 Year Olds Correlation Chart
The statistical analysis conducted on geographies consisting of 118,579,963 people shows a slight positive correlation between the proportion of Immigrants from Sudan and poverty level among females between the ages 25 and 34 in the United States with a correlation coefficient (R) of 0.062 and weighted average of 14.4%. Similarly, the statistical analysis conducted on geographies consisting of 234,780,200 people shows a strong positive correlation between the proportion of Immigrants from Netherlands and poverty level among females between the ages 25 and 34 in the United States with a correlation coefficient (R) of 0.747 and weighted average of 12.8%, a difference of 12.3%.
Female Poverty Among 25-34 Year Olds Correlation Summary
| Measurement | Immigrants from Sudan | Immigrants from Netherlands |
| Minimum | 2.8% | 2.7% |
| Maximum | 39.6% | 100.0% |
| Range | 36.9% | 97.3% |
| Mean | 15.0% | 30.8% |
| Median | 14.3% | 14.2% |
| Interquartile 25% (IQ1) | 12.0% | 11.1% |
| Interquartile 75% (IQ3) | 17.5% | 34.4% |
| Interquartile Range (IQR) | 5.5% | 23.3% |
| Standard Deviation (Sample) | 6.2% | 32.5% |
| Standard Deviation (Population) | 6.1% | 32.0% |
Similar Demographics by Female Poverty Among 25-34 Year Olds
Demographics Similar to Immigrants from Sudan by Female Poverty Among 25-34 Year Olds
In terms of female poverty among 25-34 year olds, the demographic groups most similar to Immigrants from Sudan are Nigerian (14.4%, a difference of 0.070%), Immigrants from Portugal (14.4%, a difference of 0.13%), Sudanese (14.4%, a difference of 0.20%), Immigrants from Barbados (14.5%, a difference of 0.32%), and Ghanaian (14.4%, a difference of 0.36%).
| Demographics | Rating | Rank | Female Poverty Among 25-34 Year Olds |
| Spanish American Indians | 5.5 /100 | #217 | Tragic 14.3% |
| Immigrants | Thailand | 5.2 /100 | #218 | Tragic 14.3% |
| Ecuadorians | 5.2 /100 | #219 | Tragic 14.3% |
| Ghanaians | 4.8 /100 | #220 | Tragic 14.4% |
| Sudanese | 4.4 /100 | #221 | Tragic 14.4% |
| Immigrants | Portugal | 4.3 /100 | #222 | Tragic 14.4% |
| Nigerians | 4.2 /100 | #223 | Tragic 14.4% |
| Immigrants | Sudan | 4.0 /100 | #224 | Tragic 14.4% |
| Immigrants | Barbados | 3.4 /100 | #225 | Tragic 14.5% |
| Nicaraguans | 3.3 /100 | #226 | Tragic 14.5% |
| Celtics | 2.8 /100 | #227 | Tragic 14.5% |
| Vietnamese | 2.6 /100 | #228 | Tragic 14.6% |
| Spanish | 2.5 /100 | #229 | Tragic 14.6% |
| Spaniards | 2.3 /100 | #230 | Tragic 14.6% |
| Delaware | 2.3 /100 | #231 | Tragic 14.6% |
Demographics Similar to Immigrants from Netherlands by Female Poverty Among 25-34 Year Olds
In terms of female poverty among 25-34 year olds, the demographic groups most similar to Immigrants from Netherlands are Immigrants from Canada (12.9%, a difference of 0.15%), Slovene (12.8%, a difference of 0.22%), Immigrants from Fiji (12.9%, a difference of 0.23%), Immigrants from Western Asia (12.8%, a difference of 0.24%), and Romanian (12.8%, a difference of 0.26%).
| Demographics | Rating | Rank | Female Poverty Among 25-34 Year Olds |
| Immigrants | Kuwait | 93.1 /100 | #117 | Exceptional 12.8% |
| Mongolians | 93.0 /100 | #118 | Exceptional 12.8% |
| Immigrants | Nepal | 93.0 /100 | #119 | Exceptional 12.8% |
| Carpatho Rusyns | 93.0 /100 | #120 | Exceptional 12.8% |
| Romanians | 92.8 /100 | #121 | Exceptional 12.8% |
| Immigrants | Western Asia | 92.7 /100 | #122 | Exceptional 12.8% |
| Slovenes | 92.7 /100 | #123 | Exceptional 12.8% |
| Immigrants | Netherlands | 92.0 /100 | #124 | Exceptional 12.8% |
| Immigrants | Canada | 91.5 /100 | #125 | Exceptional 12.9% |
| Immigrants | Fiji | 91.2 /100 | #126 | Exceptional 12.9% |
| Czechs | 90.3 /100 | #127 | Exceptional 12.9% |
| Syrians | 90.2 /100 | #128 | Exceptional 12.9% |
| Immigrants | North America | 89.7 /100 | #129 | Excellent 12.9% |
| Immigrants | Uzbekistan | 89.6 /100 | #130 | Excellent 12.9% |
| Pakistanis | 88.4 /100 | #131 | Excellent 13.0% |