Immigrants from Ukraine vs Yaqui Female Poverty Among 18-24 Year Olds
COMPARE
Immigrants from Ukraine
Yaqui
Female Poverty Among 18-24 Year Olds
Female Poverty Among 18-24 Year Olds Comparison
Immigrants from Ukraine
Yaqui
18.4%
FEMALE POVERTY AMONG 18-24 YEAR OLDS
99.9/ 100
METRIC RATING
58th/ 347
METRIC RANK
21.9%
FEMALE POVERTY AMONG 18-24 YEAR OLDS
0.1/ 100
METRIC RATING
278th/ 347
METRIC RANK
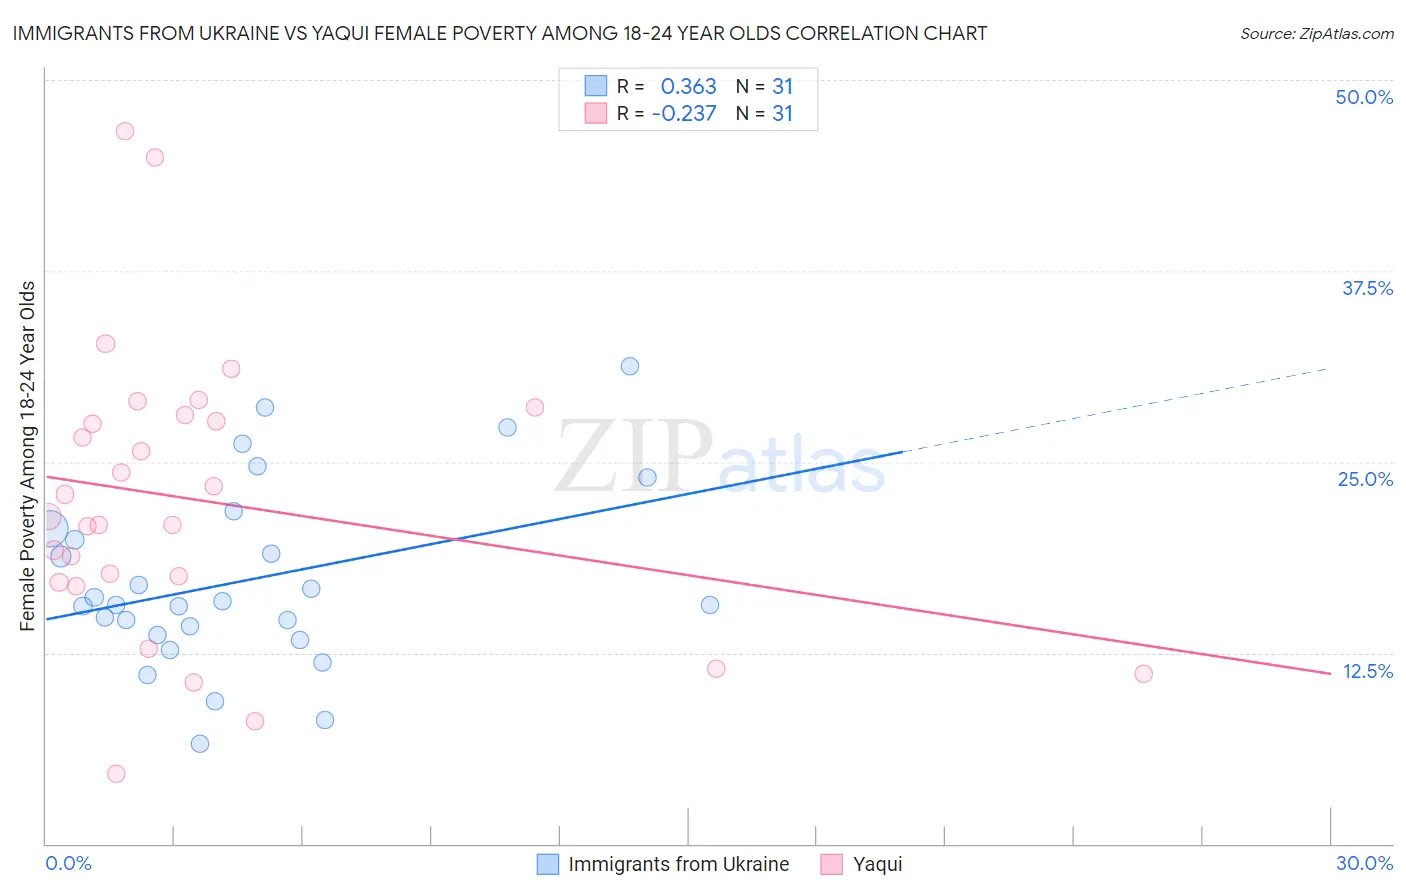
Immigrants from Ukraine vs Yaqui Female Poverty Among 18-24 Year Olds Correlation Chart
The statistical analysis conducted on geographies consisting of 283,428,309 people shows a mild positive correlation between the proportion of Immigrants from Ukraine and poverty level among females between the ages 18 and 24 in the United States with a correlation coefficient (R) of 0.363 and weighted average of 18.4%. Similarly, the statistical analysis conducted on geographies consisting of 107,118,789 people shows a weak negative correlation between the proportion of Yaqui and poverty level among females between the ages 18 and 24 in the United States with a correlation coefficient (R) of -0.237 and weighted average of 21.9%, a difference of 18.9%.
Female Poverty Among 18-24 Year Olds Correlation Summary
| Measurement | Immigrants from Ukraine | Yaqui |
| Minimum | 6.6% | 4.6% |
| Maximum | 31.3% | 46.7% |
| Range | 24.7% | 42.1% |
| Mean | 17.3% | 22.5% |
| Median | 15.7% | 21.4% |
| Interquartile 25% (IQ1) | 13.7% | 17.1% |
| Interquartile 75% (IQ3) | 20.6% | 28.1% |
| Interquartile Range (IQR) | 6.9% | 11.0% |
| Standard Deviation (Sample) | 6.0% | 9.4% |
| Standard Deviation (Population) | 5.9% | 9.3% |
Similar Demographics by Female Poverty Among 18-24 Year Olds
Demographics Similar to Immigrants from Ukraine by Female Poverty Among 18-24 Year Olds
In terms of female poverty among 18-24 year olds, the demographic groups most similar to Immigrants from Ukraine are Immigrants from Italy (18.4%, a difference of 0.060%), Argentinean (18.4%, a difference of 0.16%), Albanian (18.4%, a difference of 0.18%), Immigrants from Egypt (18.4%, a difference of 0.19%), and Egyptian (18.5%, a difference of 0.29%).
| Demographics | Rating | Rank | Female Poverty Among 18-24 Year Olds |
| Immigrants | Eastern Europe | 99.9 /100 | #51 | Exceptional 18.2% |
| Immigrants | Ireland | 99.9 /100 | #52 | Exceptional 18.3% |
| Italians | 99.9 /100 | #53 | Exceptional 18.3% |
| Immigrants | Egypt | 99.9 /100 | #54 | Exceptional 18.4% |
| Albanians | 99.9 /100 | #55 | Exceptional 18.4% |
| Argentineans | 99.9 /100 | #56 | Exceptional 18.4% |
| Immigrants | Italy | 99.9 /100 | #57 | Exceptional 18.4% |
| Immigrants | Ukraine | 99.9 /100 | #58 | Exceptional 18.4% |
| Egyptians | 99.9 /100 | #59 | Exceptional 18.5% |
| Immigrants | Brazil | 99.8 /100 | #60 | Exceptional 18.5% |
| Immigrants | Albania | 99.8 /100 | #61 | Exceptional 18.5% |
| Greeks | 99.8 /100 | #62 | Exceptional 18.5% |
| Immigrants | Belarus | 99.8 /100 | #63 | Exceptional 18.5% |
| Immigrants | Asia | 99.8 /100 | #64 | Exceptional 18.6% |
| Immigrants | Scotland | 99.8 /100 | #65 | Exceptional 18.6% |
Demographics Similar to Yaqui by Female Poverty Among 18-24 Year Olds
In terms of female poverty among 18-24 year olds, the demographic groups most similar to Yaqui are Spanish American (21.9%, a difference of 0.17%), Immigrants from Dominica (21.9%, a difference of 0.18%), Immigrants from Dominican Republic (21.9%, a difference of 0.22%), Immigrants from Switzerland (21.8%, a difference of 0.26%), and Bermudan (21.9%, a difference of 0.31%).
| Demographics | Rating | Rank | Female Poverty Among 18-24 Year Olds |
| Scotch-Irish | 0.2 /100 | #271 | Tragic 21.6% |
| Basques | 0.2 /100 | #272 | Tragic 21.7% |
| New Zealanders | 0.2 /100 | #273 | Tragic 21.7% |
| Immigrants | Honduras | 0.1 /100 | #274 | Tragic 21.8% |
| Immigrants | Bangladesh | 0.1 /100 | #275 | Tragic 21.8% |
| Bahamians | 0.1 /100 | #276 | Tragic 21.8% |
| Immigrants | Switzerland | 0.1 /100 | #277 | Tragic 21.8% |
| Yaqui | 0.1 /100 | #278 | Tragic 21.9% |
| Spanish Americans | 0.1 /100 | #279 | Tragic 21.9% |
| Immigrants | Dominica | 0.1 /100 | #280 | Tragic 21.9% |
| Immigrants | Dominican Republic | 0.1 /100 | #281 | Tragic 21.9% |
| Bermudans | 0.1 /100 | #282 | Tragic 21.9% |
| Sub-Saharan Africans | 0.0 /100 | #283 | Tragic 22.0% |
| Tlingit-Haida | 0.0 /100 | #284 | Tragic 22.0% |
| Ottawa | 0.0 /100 | #285 | Tragic 22.0% |