Immigrants from Southern Europe vs South American Indian Child Poverty Among Boys Under 16
COMPARE
Immigrants from Southern Europe
South American Indian
Child Poverty Among Boys Under 16
Child Poverty Among Boys Under 16 Comparison
Immigrants from Southern Europe
South American Indians
15.6%
CHILD POVERTY AMONG BOYS UNDER 16
86.5/ 100
METRIC RATING
138th/ 347
METRIC RANK
16.5%
CHILD POVERTY AMONG BOYS UNDER 16
44.3/ 100
METRIC RATING
181st/ 347
METRIC RANK
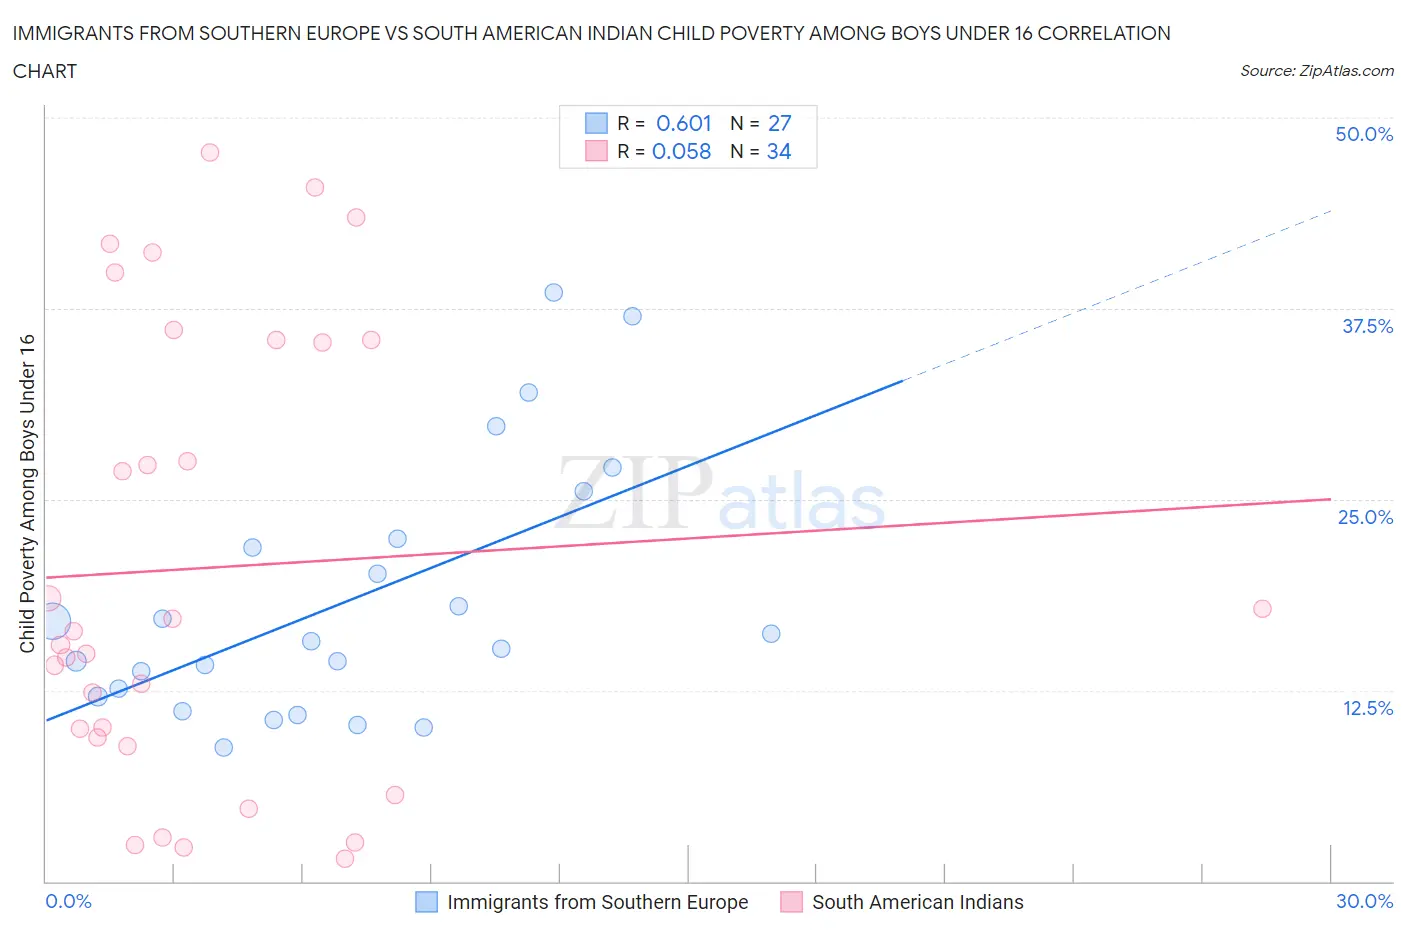
Immigrants from Southern Europe vs South American Indian Child Poverty Among Boys Under 16 Correlation Chart
The statistical analysis conducted on geographies consisting of 393,933,079 people shows a significant positive correlation between the proportion of Immigrants from Southern Europe and poverty level among boys under the age of 16 in the United States with a correlation coefficient (R) of 0.601 and weighted average of 15.6%. Similarly, the statistical analysis conducted on geographies consisting of 163,628,947 people shows a slight positive correlation between the proportion of South American Indians and poverty level among boys under the age of 16 in the United States with a correlation coefficient (R) of 0.058 and weighted average of 16.5%, a difference of 6.1%.
Child Poverty Among Boys Under 16 Correlation Summary
| Measurement | Immigrants from Southern Europe | South American Indian |
| Minimum | 8.7% | 1.4% |
| Maximum | 38.5% | 47.7% |
| Range | 29.8% | 46.2% |
| Mean | 18.4% | 20.5% |
| Median | 15.7% | 15.9% |
| Interquartile 25% (IQ1) | 12.1% | 9.4% |
| Interquartile 75% (IQ3) | 22.5% | 35.4% |
| Interquartile Range (IQR) | 10.4% | 26.0% |
| Standard Deviation (Sample) | 8.3% | 14.7% |
| Standard Deviation (Population) | 8.1% | 14.4% |
Similar Demographics by Child Poverty Among Boys Under 16
Demographics Similar to Immigrants from Southern Europe by Child Poverty Among Boys Under 16
In terms of child poverty among boys under 16, the demographic groups most similar to Immigrants from Southern Europe are Albanian (15.6%, a difference of 0.010%), Immigrants from Spain (15.6%, a difference of 0.15%), Immigrants from Kuwait (15.6%, a difference of 0.23%), Icelander (15.5%, a difference of 0.25%), and Portuguese (15.5%, a difference of 0.26%).
| Demographics | Rating | Rank | Child Poverty Among Boys Under 16 |
| Immigrants | Western Europe | 90.0 /100 | #131 | Exceptional 15.4% |
| Immigrants | Kazakhstan | 88.7 /100 | #132 | Excellent 15.5% |
| Welsh | 88.3 /100 | #133 | Excellent 15.5% |
| Peruvians | 88.1 /100 | #134 | Excellent 15.5% |
| Portuguese | 87.5 /100 | #135 | Excellent 15.5% |
| Icelanders | 87.5 /100 | #136 | Excellent 15.5% |
| Immigrants | Spain | 87.1 /100 | #137 | Excellent 15.6% |
| Immigrants | Southern Europe | 86.5 /100 | #138 | Excellent 15.6% |
| Albanians | 86.5 /100 | #139 | Excellent 15.6% |
| Immigrants | Kuwait | 85.6 /100 | #140 | Excellent 15.6% |
| Slavs | 84.5 /100 | #141 | Excellent 15.7% |
| Immigrants | Hungary | 84.1 /100 | #142 | Excellent 15.7% |
| Immigrants | Fiji | 83.6 /100 | #143 | Excellent 15.7% |
| Immigrants | Peru | 83.5 /100 | #144 | Excellent 15.7% |
| Samoans | 83.2 /100 | #145 | Excellent 15.7% |
Demographics Similar to South American Indians by Child Poverty Among Boys Under 16
In terms of child poverty among boys under 16, the demographic groups most similar to South American Indians are Lebanese (16.6%, a difference of 0.11%), Hawaiian (16.5%, a difference of 0.14%), Hungarian (16.5%, a difference of 0.34%), Scotch-Irish (16.5%, a difference of 0.36%), and Kenyan (16.6%, a difference of 0.38%).
| Demographics | Rating | Rank | Child Poverty Among Boys Under 16 |
| Uruguayans | 50.0 /100 | #174 | Average 16.4% |
| Immigrants | Syria | 49.0 /100 | #175 | Average 16.5% |
| Whites/Caucasians | 48.2 /100 | #176 | Average 16.5% |
| Ethiopians | 47.8 /100 | #177 | Average 16.5% |
| Scotch-Irish | 47.5 /100 | #178 | Average 16.5% |
| Hungarians | 47.3 /100 | #179 | Average 16.5% |
| Hawaiians | 45.5 /100 | #180 | Average 16.5% |
| South American Indians | 44.3 /100 | #181 | Average 16.5% |
| Lebanese | 43.3 /100 | #182 | Average 16.6% |
| Kenyans | 41.0 /100 | #183 | Average 16.6% |
| Celtics | 40.6 /100 | #184 | Average 16.6% |
| Immigrants | Western Asia | 40.4 /100 | #185 | Average 16.6% |
| Hmong | 38.4 /100 | #186 | Fair 16.6% |
| Immigrants | Costa Rica | 37.8 /100 | #187 | Fair 16.7% |
| Immigrants | South America | 37.7 /100 | #188 | Fair 16.7% |