Immigrants from Southern Europe vs Central American Indian Child Poverty Among Boys Under 16

COMPARE

Immigrants from Southern Europe
Race
Ancestry
AfghanAfricanAlaska NativeAlaskan AthabascanAlbanianAleutAlsatianAmericanApacheArabArapahoArgentineanArmenianAssyrian/Chaldean/SyriacAustralianAustrianBahamianBangladeshiBarbadianBasqueBelgianBelizeanBermudanBhutaneseBlackfeetBolivianBrazilianBritishBritish West IndianBulgarianBurmeseCajunCambodianCanadianCape VerdeanCarpatho RusynCelticCentral AmericanCherokeeCheyenneChickasawChileanChineseChippewaChoctawColombianColvilleComancheCosta RicanCreeCreekCroatianCrowCubanCypriotCzechCzechoslovakianDanishDelawareDominicanDutchDutch West IndianEastern EuropeanEcuadorianEgyptianEnglishEstonianEthiopianEuropeanFijianFilipinoFinnishFrenchFrench American IndianFrench CanadianGermanGerman RussianGhanaianGreekGuamanian/ChamorroGuatemalanGuyaneseHaitianHmongHonduranHopiHoumaHungarianIcelanderIndian (Asian)IndonesianInupiatIranianIraqiIrishIroquoisIsraeliItalianJamaicanJapaneseJordanianKenyanKiowaKoreanLaotianLatvianLebaneseLiberianLithuanianLumbeeLuxembourgerMacedonianMalaysianMalteseMarshalleseMenomineeMexicanMexican American IndianMongolianMoroccanNative HawaiianNavajoNepaleseNew ZealanderNicaraguanNigerianNorthern EuropeanNorwegianOkinawanOsageOttawaPaiutePakistaniPalestinianPanamanianParaguayanPennsylvania GermanPeruvianPimaPolishPortuguesePotawatomiPuebloPuerto RicanPuget Sound SalishRomanianRussianSalvadoranSamoanScandinavianScotch-IrishScottishSeminoleSenegaleseSerbianShoshoneSierra LeoneanSiouxSlavicSlovakSloveneSomaliSouth AfricanSouth AmericanSouth American IndianSoviet UnionSpaniardSpanishSpanish AmericanSpanish American IndianSri LankanSubsaharan AfricanSudaneseSwedishSwissSyrianTaiwaneseThaiTlingit-HaidaTohono O'OdhamTonganTrinidadian and TobagonianTsimshianTurkishU.S. Virgin IslanderUgandanUkrainianUruguayanUteVenezuelanVietnameseWelshWest IndianYakamaYaquiYugoslavianYumanYup'ikZimbabwean
Immigration
NonimmigrantsImmigrantsAfghanistanAfricaAlbaniaArgentinaArmeniaAsiaAustraliaAustriaBahamasBangladeshBarbadosBelarusBelgiumBelizeBoliviaBosnia and HerzegovinaBrazilBulgariaBurma/MyanmarCabo VerdeCambodiaCameroonCanadaCaribbeanCentral AmericaChileChinaColombiaCongoCosta RicaCroatiaCubaCzechoslovakiaDenmarkDominicaDominican RepublicEastern AfricaEastern AsiaEastern EuropeEcuadorEgyptEl SalvadorEnglandEritreaEthiopiaEuropeFijiFranceGermanyGhanaGreeceGrenadaGuatemalaGuyanaHaitiHondurasHong KongHungaryIndiaIndonesiaIranIraqIrelandIsraelItalyJamaicaJapanJordanKazakhstanKenyaKoreaKuwaitLaosLatin AmericaLatviaLebanonLiberiaLithuaniaMalaysiaMexicoMicronesiaMiddle AfricaMoldovaMoroccoNepalNetherlandsNicaraguaNigeriaNorth AmericaNorth MacedoniaNorthern AfricaNorthern EuropeNorwayOceaniaPakistanPanamaPeruPhilippinesPolandPortugalRomaniaRussiaSaudi ArabiaScotlandSenegalSerbiaSierra LeoneSingaporeSomaliaSouth AfricaSouth AmericaSouth Central AsiaSouth Eastern AsiaSouthern EuropeSpainSri LankaSt. Vincent and the GrenadinesSudanSwedenSwitzerlandSyriaTaiwanThailandTrinidad and TobagoTurkeyUgandaUkraineUruguayUzbekistanVenezuelaVietnamWest IndiesWestern AfricaWestern AsiaWestern EuropeYemenZaireZimbabweAzores
Central American Indian
Race
Ancestry
AfghanAfricanAlaska NativeAlaskan AthabascanAlbanianAleutAlsatianAmericanApacheArabArapahoArgentineanArmenianAssyrian/Chaldean/SyriacAustralianAustrianBahamianBangladeshiBarbadianBasqueBelgianBelizeanBermudanBhutaneseBlackfeetBolivianBrazilianBritishBritish West IndianBulgarianBurmeseCajunCambodianCanadianCape VerdeanCarpatho RusynCelticCentral AmericanCentral American IndianCherokeeCheyenneChickasawChileanChineseChippewaChoctawColombianColvilleComancheCosta RicanCreeCreekCroatianCrowCubanCypriotCzechCzechoslovakianDanishDelawareDominicanDutchDutch West IndianEastern EuropeanEcuadorianEgyptianEnglishEstonianEthiopianEuropeanFijianFilipinoFinnishFrenchFrench American IndianFrench CanadianGermanGerman RussianGhanaianGreekGuamanian/ChamorroGuatemalanGuyaneseHaitianHmongHonduranHopiHoumaHungarianIcelanderIndian (Asian)IndonesianInupiatIranianIraqiIrishIroquoisIsraeliItalianJamaicanJapaneseJordanianKenyanKiowaKoreanLaotianLatvianLebaneseLiberianLithuanianLumbeeLuxembourgerMacedonianMalaysianMalteseMarshalleseMenomineeMexicanMexican American IndianMongolianMoroccanNative HawaiianNavajoNepaleseNew ZealanderNicaraguanNigerianNorthern EuropeanNorwegianOkinawanOsageOttawaPaiutePakistaniPalestinianPanamanianParaguayanPennsylvania GermanPeruvianPimaPolishPortuguesePotawatomiPuebloPuerto RicanPuget Sound SalishRomanianRussianSalvadoranSamoanScandinavianScotch-IrishScottishSeminoleSenegaleseSerbianShoshoneSierra LeoneanSiouxSlavicSlovakSloveneSomaliSouth AfricanSouth AmericanSouth American IndianSoviet UnionSpaniardSpanishSpanish AmericanSpanish American IndianSri LankanSubsaharan AfricanSudaneseSwedishSwissSyrianTaiwaneseThaiTlingit-HaidaTohono O'OdhamTonganTrinidadian and TobagonianTsimshianTurkishU.S. Virgin IslanderUgandanUkrainianUruguayanUteVenezuelanVietnameseWelshWest IndianYakamaYaquiYugoslavianYumanYup'ikZimbabwean
Immigration
NonimmigrantsImmigrantsAfghanistanAfricaAlbaniaArgentinaArmeniaAsiaAustraliaAustriaBahamasBangladeshBarbadosBelarusBelgiumBelizeBoliviaBosnia and HerzegovinaBrazilBulgariaBurma/MyanmarCabo VerdeCambodiaCameroonCanadaCaribbeanCentral AmericaChileChinaColombiaCongoCosta RicaCroatiaCubaCzechoslovakiaDenmarkDominicaDominican RepublicEastern AfricaEastern AsiaEastern EuropeEcuadorEgyptEl SalvadorEnglandEritreaEthiopiaEuropeFijiFranceGermanyGhanaGreeceGrenadaGuatemalaGuyanaHaitiHondurasHong KongHungaryIndiaIndonesiaIranIraqIrelandIsraelItalyJamaicaJapanJordanKazakhstanKenyaKoreaKuwaitLaosLatin AmericaLatviaLebanonLiberiaLithuaniaMalaysiaMexicoMicronesiaMiddle AfricaMoldovaMoroccoNepalNetherlandsNicaraguaNigeriaNorth AmericaNorth MacedoniaNorthern AfricaNorthern EuropeNorwayOceaniaPakistanPanamaPeruPhilippinesPolandPortugalRomaniaRussiaSaudi ArabiaScotlandSenegalSerbiaSierra LeoneSingaporeSomaliaSouth AfricaSouth AmericaSouth Central AsiaSouth Eastern AsiaSpainSri LankaSt. Vincent and the GrenadinesSudanSwedenSwitzerlandSyriaTaiwanThailandTrinidad and TobagoTurkeyUgandaUkraineUruguayUzbekistanVenezuelaVietnamWest IndiesWestern AfricaWestern AsiaWestern EuropeYemenZaireZimbabweAzores
Child Poverty Among Boys Under 16
Income
Poverty
Unemployment
Labor Participation
Family Structure
Vehicle Availability
Education Level
Disability

Child Poverty Among Boys Under 16 Comparison

Immigrants from Southern Europe

Central American Indians

Excellent
Tragic
15.6%
CHILD POVERTY AMONG BOYS UNDER 16
86.5/ 100
METRIC RATING
138th/ 347
METRIC RANK
22.5%
CHILD POVERTY AMONG BOYS UNDER 16
0.0/ 100
METRIC RATING
325th/ 347
METRIC RANK

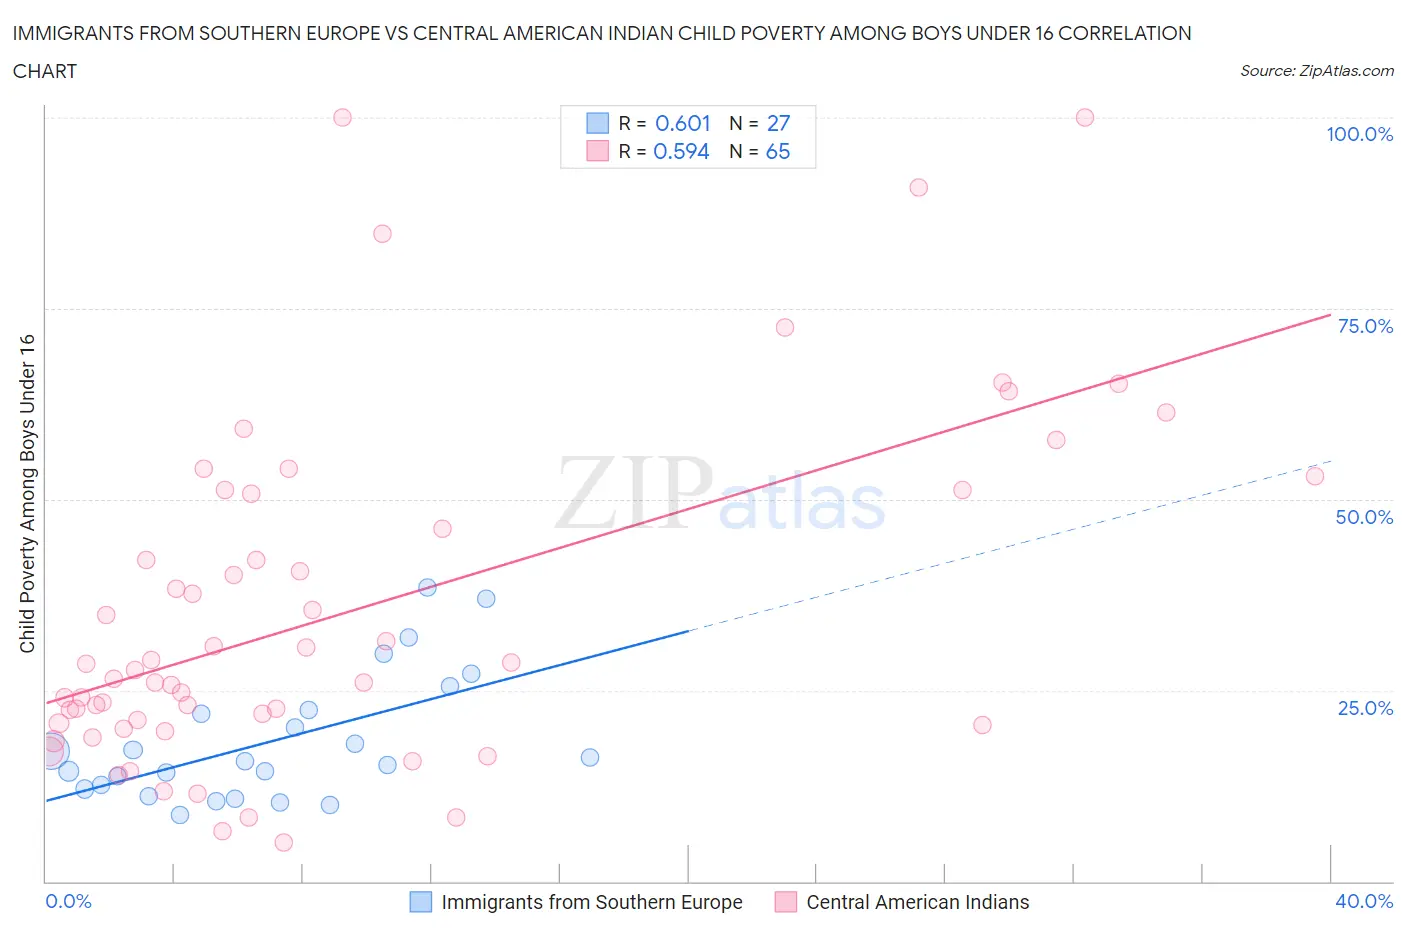
Immigrants from Southern Europe vs Central American Indian Child Poverty Among Boys Under 16 Correlation Chart

The statistical analysis conducted on geographies consisting of 393,933,079 people shows a significant positive correlation between the proportion of Immigrants from Southern Europe and poverty level among boys under the age of 16 in the United States with a correlation coefficient (R) of 0.601 and weighted average of 15.6%. Similarly, the statistical analysis conducted on geographies consisting of 323,455,194 people shows a substantial positive correlation between the proportion of Central American Indians and poverty level among boys under the age of 16 in the United States with a correlation coefficient (R) of 0.594 and weighted average of 22.5%, a difference of 44.5%.
Immigrants from Southern Europe vs Central American Indian Child Poverty Among Boys Under 16

Child Poverty Among Boys Under 16 Correlation Summary

MeasurementImmigrants from Southern EuropeCentral American Indian
Minimum8.7%5.0%
Maximum38.5%100.0%
Range29.8%95.0%
Mean18.4%35.4%
Median15.7%27.6%
Interquartile 25% (IQ1)12.1%20.6%
Interquartile 75% (IQ3)22.5%51.0%
Interquartile Range (IQR)10.4%30.4%
Standard Deviation (Sample)8.3%22.3%
Standard Deviation (Population)8.1%22.1%

Similar Demographics by Child Poverty Among Boys Under 16

Demographics Similar to Immigrants from Southern Europe by Child Poverty Among Boys Under 16

In terms of child poverty among boys under 16, the demographic groups most similar to Immigrants from Southern Europe are Albanian (15.6%, a difference of 0.010%), Immigrants from Spain (15.6%, a difference of 0.15%), Immigrants from Kuwait (15.6%, a difference of 0.23%), Icelander (15.5%, a difference of 0.25%), and Portuguese (15.5%, a difference of 0.26%).
DemographicsRating | RankChild Poverty Among Boys Under 16
Immigrants | Western Europe
90.0
/100
|
#131
Exceptional
15.4%
Immigrants | Kazakhstan
88.7
/100
|
#132
Excellent
15.5%
Welsh
88.3
/100
|
#133
Excellent
15.5%
Peruvians
88.1
/100
|
#134
Excellent
15.5%
Portuguese
87.5
/100
|
#135
Excellent
15.5%
Icelanders
87.5
/100
|
#136
Excellent
15.5%
Immigrants | Spain
87.1
/100
|
#137
Excellent
15.6%
Immigrants | Southern Europe
86.5
/100
|
#138
Excellent
15.6%
Albanians
86.5
/100
|
#139
Excellent
15.6%
Immigrants | Kuwait
85.6
/100
|
#140
Excellent
15.6%
Slavs
84.5
/100
|
#141
Excellent
15.7%
Immigrants | Hungary
84.1
/100
|
#142
Excellent
15.7%
Immigrants | Fiji
83.6
/100
|
#143
Excellent
15.7%
Immigrants | Peru
83.5
/100
|
#144
Excellent
15.7%
Samoans
83.2
/100
|
#145
Excellent
15.7%

Demographics Similar to Central American Indians by Child Poverty Among Boys Under 16

In terms of child poverty among boys under 16, the demographic groups most similar to Central American Indians are Immigrants from Congo (22.4%, a difference of 0.50%), Honduran (22.3%, a difference of 0.87%), Paiute (22.8%, a difference of 1.1%), Immigrants from Honduras (22.8%, a difference of 1.3%), and Immigrants from Dominica (22.2%, a difference of 1.4%).
DemographicsRating | RankChild Poverty Among Boys Under 16
Yakama
0.0
/100
|
#318
Tragic
21.7%
Dutch West Indians
0.0
/100
|
#319
Tragic
21.8%
U.S. Virgin Islanders
0.0
/100
|
#320
Tragic
22.0%
Cajuns
0.0
/100
|
#321
Tragic
22.2%
Immigrants | Dominica
0.0
/100
|
#322
Tragic
22.2%
Hondurans
0.0
/100
|
#323
Tragic
22.3%
Immigrants | Congo
0.0
/100
|
#324
Tragic
22.4%
Central American Indians
0.0
/100
|
#325
Tragic
22.5%
Paiute
0.0
/100
|
#326
Tragic
22.8%
Immigrants | Honduras
0.0
/100
|
#327
Tragic
22.8%
Pueblo
0.0
/100
|
#328
Tragic
23.5%
Natives/Alaskans
0.0
/100
|
#329
Tragic
24.0%
Colville
0.0
/100
|
#330
Tragic
24.1%
Dominicans
0.0
/100
|
#331
Tragic
24.2%
Immigrants | Dominican Republic
0.0
/100
|
#332
Tragic
24.3%