Immigrants from Somalia vs Liberian Child Poverty Among Boys Under 16
COMPARE
Immigrants from Somalia
Liberian
Child Poverty Among Boys Under 16
Child Poverty Among Boys Under 16 Comparison
Immigrants from Somalia
Liberians
21.7%
CHILD POVERTY AMONG BOYS UNDER 16
0.0/ 100
METRIC RATING
315th/ 347
METRIC RANK
19.3%
CHILD POVERTY AMONG BOYS UNDER 16
0.2/ 100
METRIC RATING
253rd/ 347
METRIC RANK
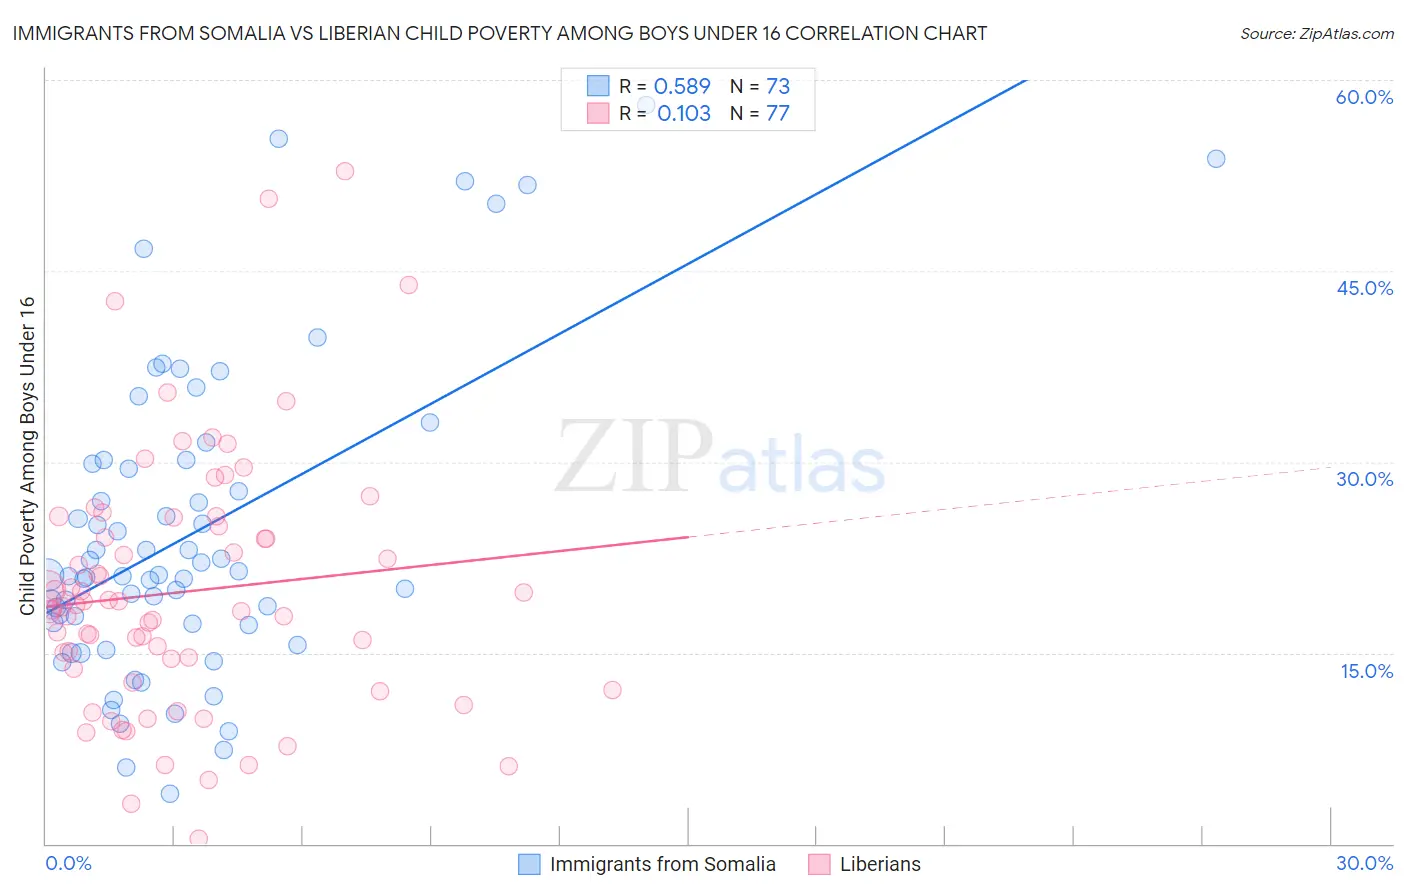
Immigrants from Somalia vs Liberian Child Poverty Among Boys Under 16 Correlation Chart
The statistical analysis conducted on geographies consisting of 91,851,644 people shows a substantial positive correlation between the proportion of Immigrants from Somalia and poverty level among boys under the age of 16 in the United States with a correlation coefficient (R) of 0.589 and weighted average of 21.7%. Similarly, the statistical analysis conducted on geographies consisting of 117,632,985 people shows a poor positive correlation between the proportion of Liberians and poverty level among boys under the age of 16 in the United States with a correlation coefficient (R) of 0.103 and weighted average of 19.3%, a difference of 12.6%.
Child Poverty Among Boys Under 16 Correlation Summary
| Measurement | Immigrants from Somalia | Liberian |
| Minimum | 3.9% | 0.35% |
| Maximum | 58.0% | 52.8% |
| Range | 54.1% | 52.5% |
| Mean | 24.4% | 19.8% |
| Median | 21.1% | 18.6% |
| Interquartile 25% (IQ1) | 17.2% | 13.2% |
| Interquartile 75% (IQ3) | 30.0% | 25.3% |
| Interquartile Range (IQR) | 12.7% | 12.0% |
| Standard Deviation (Sample) | 12.2% | 10.1% |
| Standard Deviation (Population) | 12.1% | 10.0% |
Similar Demographics by Child Poverty Among Boys Under 16
Demographics Similar to Immigrants from Somalia by Child Poverty Among Boys Under 16
In terms of child poverty among boys under 16, the demographic groups most similar to Immigrants from Somalia are Menominee (21.7%, a difference of 0.0%), African (21.7%, a difference of 0.090%), Yakama (21.7%, a difference of 0.14%), Ute (21.6%, a difference of 0.60%), and British West Indian (21.6%, a difference of 0.61%).
| Demographics | Rating | Rank | Child Poverty Among Boys Under 16 |
| Immigrants | Mexico | 0.0 /100 | #308 | Tragic 21.5% |
| Seminole | 0.0 /100 | #309 | Tragic 21.5% |
| Creek | 0.0 /100 | #310 | Tragic 21.5% |
| Bahamians | 0.0 /100 | #311 | Tragic 21.6% |
| Immigrants | Guatemala | 0.0 /100 | #312 | Tragic 21.6% |
| British West Indians | 0.0 /100 | #313 | Tragic 21.6% |
| Ute | 0.0 /100 | #314 | Tragic 21.6% |
| Immigrants | Somalia | 0.0 /100 | #315 | Tragic 21.7% |
| Menominee | 0.0 /100 | #316 | Tragic 21.7% |
| Africans | 0.0 /100 | #317 | Tragic 21.7% |
| Yakama | 0.0 /100 | #318 | Tragic 21.7% |
| Dutch West Indians | 0.0 /100 | #319 | Tragic 21.8% |
| U.S. Virgin Islanders | 0.0 /100 | #320 | Tragic 22.0% |
| Cajuns | 0.0 /100 | #321 | Tragic 22.2% |
| Immigrants | Dominica | 0.0 /100 | #322 | Tragic 22.2% |
Demographics Similar to Liberians by Child Poverty Among Boys Under 16
In terms of child poverty among boys under 16, the demographic groups most similar to Liberians are Immigrants from Western Africa (19.3%, a difference of 0.070%), Trinidadian and Tobagonian (19.3%, a difference of 0.27%), Ecuadorian (19.3%, a difference of 0.27%), French American Indian (19.2%, a difference of 0.30%), and Immigrants from Liberia (19.3%, a difference of 0.30%).
| Demographics | Rating | Rank | Child Poverty Among Boys Under 16 |
| Immigrants | Nicaragua | 0.4 /100 | #246 | Tragic 19.0% |
| Immigrants | Trinidad and Tobago | 0.3 /100 | #247 | Tragic 19.0% |
| Salvadorans | 0.3 /100 | #248 | Tragic 19.0% |
| Alsatians | 0.3 /100 | #249 | Tragic 19.1% |
| Immigrants | Burma/Myanmar | 0.2 /100 | #250 | Tragic 19.2% |
| French American Indians | 0.2 /100 | #251 | Tragic 19.2% |
| Immigrants | Western Africa | 0.2 /100 | #252 | Tragic 19.3% |
| Liberians | 0.2 /100 | #253 | Tragic 19.3% |
| Trinidadians and Tobagonians | 0.2 /100 | #254 | Tragic 19.3% |
| Ecuadorians | 0.2 /100 | #255 | Tragic 19.3% |
| Immigrants | Liberia | 0.2 /100 | #256 | Tragic 19.3% |
| Mexican American Indians | 0.2 /100 | #257 | Tragic 19.4% |
| Potawatomi | 0.2 /100 | #258 | Tragic 19.4% |
| Spanish Americans | 0.2 /100 | #259 | Tragic 19.4% |
| Shoshone | 0.2 /100 | #260 | Tragic 19.4% |