Immigrants from Somalia vs Immigrants from Dominican Republic Child Poverty Among Boys Under 16
COMPARE
Immigrants from Somalia
Immigrants from Dominican Republic
Child Poverty Among Boys Under 16
Child Poverty Among Boys Under 16 Comparison
Immigrants from Somalia
Immigrants from Dominican Republic
21.7%
CHILD POVERTY AMONG BOYS UNDER 16
0.0/ 100
METRIC RATING
315th/ 347
METRIC RANK
24.3%
CHILD POVERTY AMONG BOYS UNDER 16
0.0/ 100
METRIC RATING
332nd/ 347
METRIC RANK
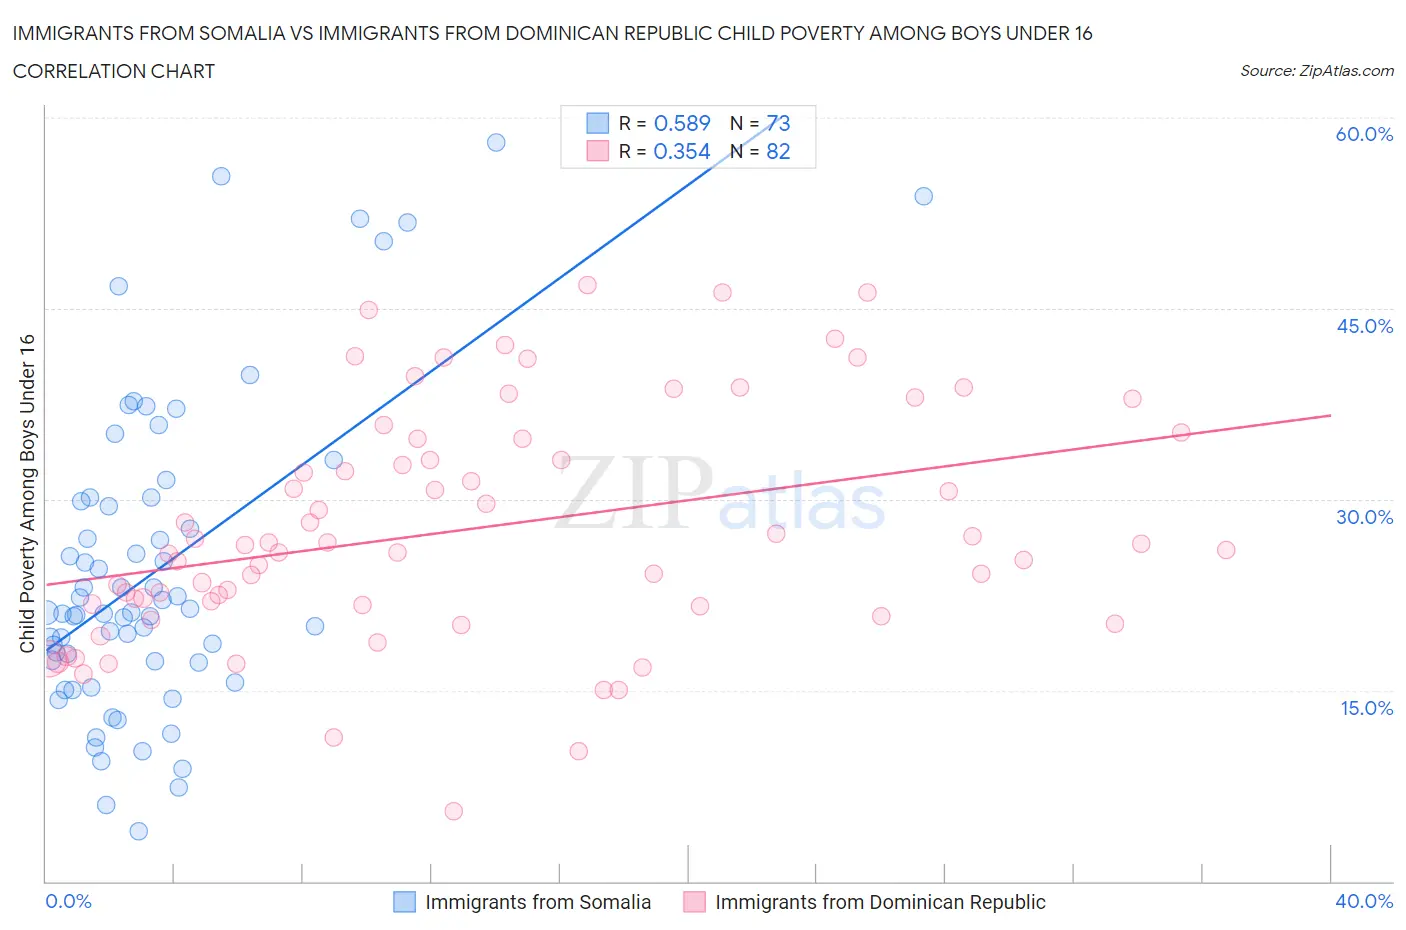
Immigrants from Somalia vs Immigrants from Dominican Republic Child Poverty Among Boys Under 16 Correlation Chart
The statistical analysis conducted on geographies consisting of 91,851,644 people shows a substantial positive correlation between the proportion of Immigrants from Somalia and poverty level among boys under the age of 16 in the United States with a correlation coefficient (R) of 0.589 and weighted average of 21.7%. Similarly, the statistical analysis conducted on geographies consisting of 271,516,954 people shows a mild positive correlation between the proportion of Immigrants from Dominican Republic and poverty level among boys under the age of 16 in the United States with a correlation coefficient (R) of 0.354 and weighted average of 24.3%, a difference of 12.0%.
Child Poverty Among Boys Under 16 Correlation Summary
| Measurement | Immigrants from Somalia | Immigrants from Dominican Republic |
| Minimum | 3.9% | 5.5% |
| Maximum | 58.0% | 46.9% |
| Range | 54.1% | 41.4% |
| Mean | 24.4% | 27.7% |
| Median | 21.1% | 26.2% |
| Interquartile 25% (IQ1) | 17.2% | 21.7% |
| Interquartile 75% (IQ3) | 30.0% | 34.8% |
| Interquartile Range (IQR) | 12.7% | 13.0% |
| Standard Deviation (Sample) | 12.2% | 9.2% |
| Standard Deviation (Population) | 12.1% | 9.1% |
Demographics Similar to Immigrants from Somalia and Immigrants from Dominican Republic by Child Poverty Among Boys Under 16
In terms of child poverty among boys under 16, the demographic groups most similar to Immigrants from Somalia are Menominee (21.7%, a difference of 0.0%), African (21.7%, a difference of 0.090%), Yakama (21.7%, a difference of 0.14%), Ute (21.6%, a difference of 0.60%), and British West Indian (21.6%, a difference of 0.61%). Similarly, the demographic groups most similar to Immigrants from Dominican Republic are Dominican (24.2%, a difference of 0.59%), Apache (24.5%, a difference of 0.72%), Colville (24.1%, a difference of 0.93%), Native/Alaskan (24.0%, a difference of 1.5%), and Pueblo (23.5%, a difference of 3.4%).
| Demographics | Rating | Rank | Child Poverty Among Boys Under 16 |
| British West Indians | 0.0 /100 | #313 | Tragic 21.6% |
| Ute | 0.0 /100 | #314 | Tragic 21.6% |
| Immigrants | Somalia | 0.0 /100 | #315 | Tragic 21.7% |
| Menominee | 0.0 /100 | #316 | Tragic 21.7% |
| Africans | 0.0 /100 | #317 | Tragic 21.7% |
| Yakama | 0.0 /100 | #318 | Tragic 21.7% |
| Dutch West Indians | 0.0 /100 | #319 | Tragic 21.8% |
| U.S. Virgin Islanders | 0.0 /100 | #320 | Tragic 22.0% |
| Cajuns | 0.0 /100 | #321 | Tragic 22.2% |
| Immigrants | Dominica | 0.0 /100 | #322 | Tragic 22.2% |
| Hondurans | 0.0 /100 | #323 | Tragic 22.3% |
| Immigrants | Congo | 0.0 /100 | #324 | Tragic 22.4% |
| Central American Indians | 0.0 /100 | #325 | Tragic 22.5% |
| Paiute | 0.0 /100 | #326 | Tragic 22.8% |
| Immigrants | Honduras | 0.0 /100 | #327 | Tragic 22.8% |
| Pueblo | 0.0 /100 | #328 | Tragic 23.5% |
| Natives/Alaskans | 0.0 /100 | #329 | Tragic 24.0% |
| Colville | 0.0 /100 | #330 | Tragic 24.1% |
| Dominicans | 0.0 /100 | #331 | Tragic 24.2% |
| Immigrants | Dominican Republic | 0.0 /100 | #332 | Tragic 24.3% |
| Apache | 0.0 /100 | #333 | Tragic 24.5% |