Immigrants from Scotland vs Okinawan Child Poverty Under the Age of 16
COMPARE
Immigrants from Scotland
Okinawan
Child Poverty Under the Age of 16
Child Poverty Under the Age of 16 Comparison
Immigrants from Scotland
Okinawans
13.7%
CHILD POVERTY UNDER THE AGE OF 16
99.4/ 100
METRIC RATING
40th/ 347
METRIC RANK
13.1%
CHILD POVERTY UNDER THE AGE OF 16
99.8/ 100
METRIC RATING
20th/ 347
METRIC RANK
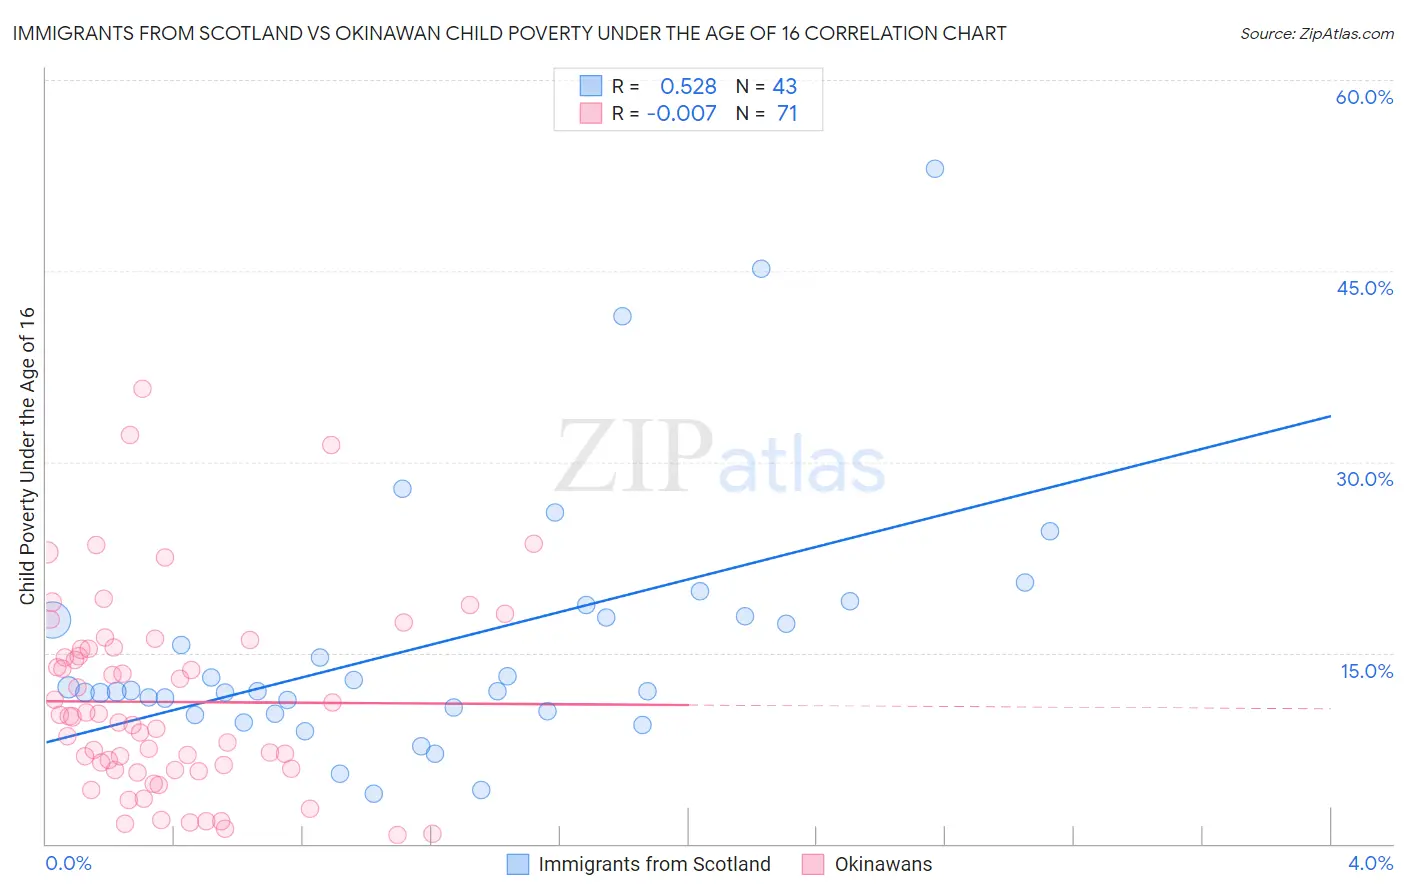
Immigrants from Scotland vs Okinawan Child Poverty Under the Age of 16 Correlation Chart
The statistical analysis conducted on geographies consisting of 195,173,280 people shows a substantial positive correlation between the proportion of Immigrants from Scotland and poverty level among children under the age of 16 in the United States with a correlation coefficient (R) of 0.528 and weighted average of 13.7%. Similarly, the statistical analysis conducted on geographies consisting of 73,512,970 people shows no correlation between the proportion of Okinawans and poverty level among children under the age of 16 in the United States with a correlation coefficient (R) of -0.007 and weighted average of 13.1%, a difference of 4.6%.
Child Poverty Under the Age of 16 Correlation Summary
| Measurement | Immigrants from Scotland | Okinawan |
| Minimum | 3.9% | 0.69% |
| Maximum | 53.0% | 35.7% |
| Range | 49.1% | 35.0% |
| Mean | 15.7% | 11.1% |
| Median | 12.0% | 10.0% |
| Interquartile 25% (IQ1) | 10.4% | 5.8% |
| Interquartile 75% (IQ3) | 17.9% | 15.3% |
| Interquartile Range (IQR) | 7.5% | 9.5% |
| Standard Deviation (Sample) | 10.1% | 7.5% |
| Standard Deviation (Population) | 10.0% | 7.5% |
Demographics Similar to Immigrants from Scotland and Okinawans by Child Poverty Under the Age of 16
In terms of child poverty under the age of 16, the demographic groups most similar to Immigrants from Scotland are Immigrants from Australia (13.6%, a difference of 0.69%), Luxembourger (13.6%, a difference of 0.71%), Immigrants from Bolivia (13.6%, a difference of 1.2%), Immigrants from Northern Europe (13.6%, a difference of 1.2%), and Lithuanian (13.5%, a difference of 1.5%). Similarly, the demographic groups most similar to Okinawans are Immigrants from Eastern Asia (13.1%, a difference of 0.030%), Maltese (13.1%, a difference of 0.11%), Indian (Asian) (13.1%, a difference of 0.15%), Latvian (13.2%, a difference of 0.36%), and Eastern European (13.2%, a difference of 0.44%).
| Demographics | Rating | Rank | Child Poverty Under the Age of 16 |
| Okinawans | 99.8 /100 | #20 | Exceptional 13.1% |
| Immigrants | Eastern Asia | 99.8 /100 | #21 | Exceptional 13.1% |
| Maltese | 99.8 /100 | #22 | Exceptional 13.1% |
| Indians (Asian) | 99.8 /100 | #23 | Exceptional 13.1% |
| Latvians | 99.8 /100 | #24 | Exceptional 13.2% |
| Eastern Europeans | 99.8 /100 | #25 | Exceptional 13.2% |
| Bolivians | 99.8 /100 | #26 | Exceptional 13.2% |
| Immigrants | China | 99.8 /100 | #27 | Exceptional 13.3% |
| Assyrians/Chaldeans/Syriacs | 99.7 /100 | #28 | Exceptional 13.3% |
| Swedes | 99.7 /100 | #29 | Exceptional 13.3% |
| Turks | 99.7 /100 | #30 | Exceptional 13.4% |
| Danes | 99.7 /100 | #31 | Exceptional 13.4% |
| Tongans | 99.7 /100 | #32 | Exceptional 13.4% |
| Asians | 99.6 /100 | #33 | Exceptional 13.5% |
| Russians | 99.6 /100 | #34 | Exceptional 13.5% |
| Lithuanians | 99.6 /100 | #35 | Exceptional 13.5% |
| Immigrants | Northern Europe | 99.6 /100 | #36 | Exceptional 13.6% |
| Immigrants | Bolivia | 99.6 /100 | #37 | Exceptional 13.6% |
| Luxembourgers | 99.5 /100 | #38 | Exceptional 13.6% |
| Immigrants | Australia | 99.5 /100 | #39 | Exceptional 13.6% |
| Immigrants | Scotland | 99.4 /100 | #40 | Exceptional 13.7% |