Immigrants from Scotland vs Okinawan 12th Grade, No Diploma
COMPARE
Immigrants from Scotland
Okinawan
12th Grade, No Diploma
12th Grade, No Diploma Comparison
Immigrants from Scotland
Okinawans
93.0%
12TH GRADE, NO DIPLOMA
99.9/ 100
METRIC RATING
33rd/ 347
METRIC RANK
93.0%
12TH GRADE, NO DIPLOMA
99.9/ 100
METRIC RATING
34th/ 347
METRIC RANK
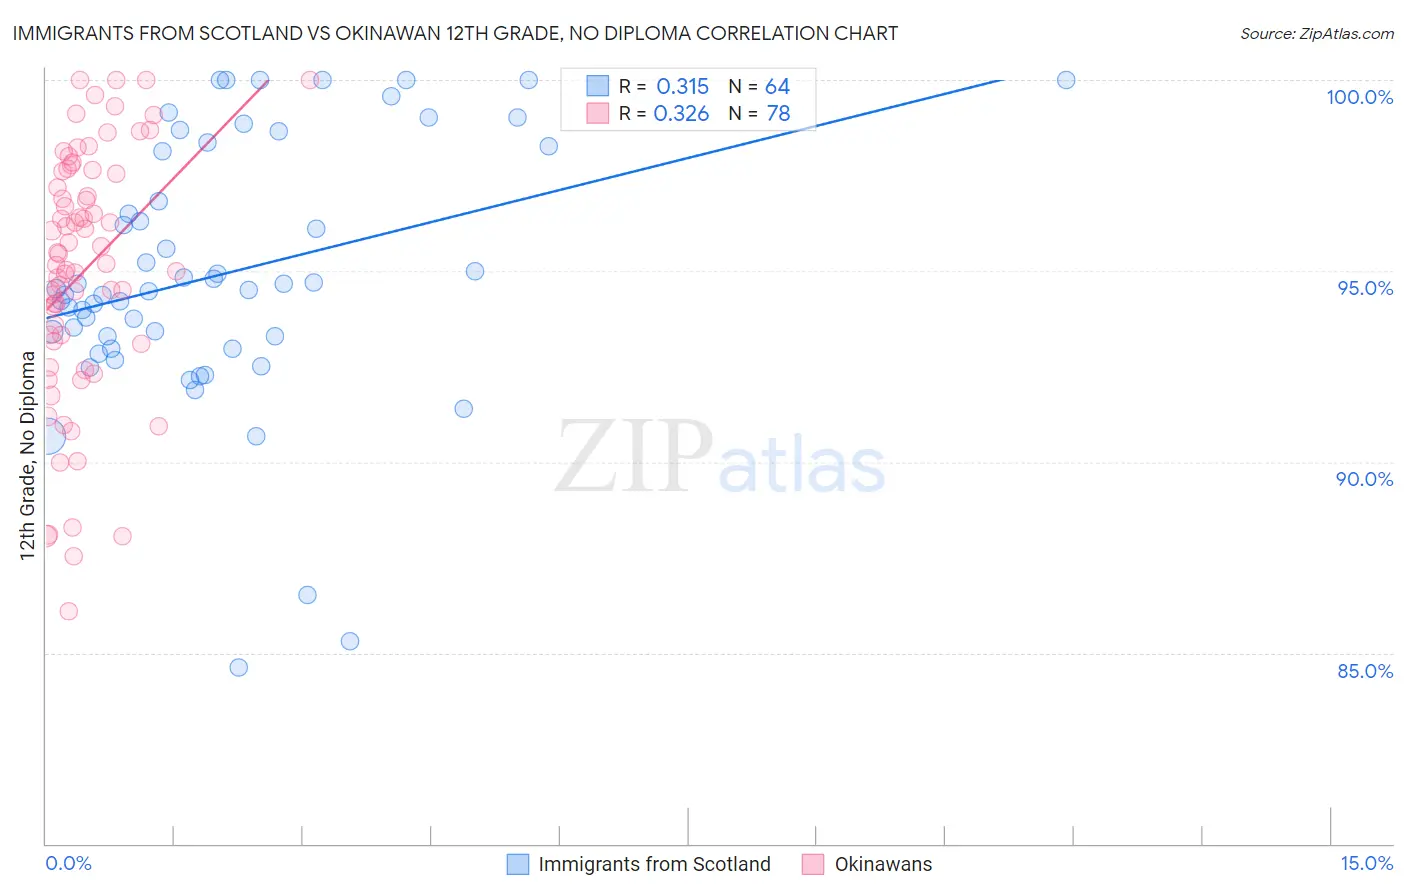
Immigrants from Scotland vs Okinawan 12th Grade, No Diploma Correlation Chart
The statistical analysis conducted on geographies consisting of 196,398,887 people shows a mild positive correlation between the proportion of Immigrants from Scotland and percentage of population with at least 12th grade (no diploma) education in the United States with a correlation coefficient (R) of 0.315 and weighted average of 93.0%. Similarly, the statistical analysis conducted on geographies consisting of 73,775,797 people shows a mild positive correlation between the proportion of Okinawans and percentage of population with at least 12th grade (no diploma) education in the United States with a correlation coefficient (R) of 0.326 and weighted average of 93.0%, a difference of 0.020%.
12th Grade, No Diploma Correlation Summary
| Measurement | Immigrants from Scotland | Okinawan |
| Minimum | 84.6% | 86.1% |
| Maximum | 100.0% | 100.0% |
| Range | 15.4% | 13.9% |
| Mean | 94.9% | 95.0% |
| Median | 94.5% | 95.3% |
| Interquartile 25% (IQ1) | 93.1% | 93.2% |
| Interquartile 75% (IQ3) | 98.2% | 97.6% |
| Interquartile Range (IQR) | 5.1% | 4.4% |
| Standard Deviation (Sample) | 3.4% | 3.3% |
| Standard Deviation (Population) | 3.4% | 3.3% |
Demographics Similar to Immigrants from Scotland and Okinawans by 12th Grade, No Diploma
In terms of 12th grade, no diploma, the demographic groups most similar to Immigrants from Scotland are European (93.1%, a difference of 0.030%), English (93.0%, a difference of 0.030%), Scottish (93.0%, a difference of 0.030%), Irish (93.0%, a difference of 0.030%), and Immigrants from Ireland (93.1%, a difference of 0.050%). Similarly, the demographic groups most similar to Okinawans are English (93.0%, a difference of 0.0%), Scottish (93.0%, a difference of 0.010%), Irish (93.0%, a difference of 0.010%), Tlingit-Haida (93.0%, a difference of 0.040%), and Immigrants from Austria (93.0%, a difference of 0.050%).
| Demographics | Rating | Rank | 12th Grade, No Diploma |
| Scandinavians | 99.9 /100 | #23 | Exceptional 93.2% |
| Thais | 99.9 /100 | #24 | Exceptional 93.2% |
| Czechs | 99.9 /100 | #25 | Exceptional 93.2% |
| Russians | 99.9 /100 | #26 | Exceptional 93.2% |
| Cypriots | 99.9 /100 | #27 | Exceptional 93.1% |
| Immigrants | Northern Europe | 99.9 /100 | #28 | Exceptional 93.1% |
| Iranians | 99.9 /100 | #29 | Exceptional 93.1% |
| Immigrants | Lithuania | 99.9 /100 | #30 | Exceptional 93.1% |
| Immigrants | Ireland | 99.9 /100 | #31 | Exceptional 93.1% |
| Europeans | 99.9 /100 | #32 | Exceptional 93.1% |
| Immigrants | Scotland | 99.9 /100 | #33 | Exceptional 93.0% |
| Okinawans | 99.9 /100 | #34 | Exceptional 93.0% |
| English | 99.9 /100 | #35 | Exceptional 93.0% |
| Scottish | 99.9 /100 | #36 | Exceptional 93.0% |
| Irish | 99.9 /100 | #37 | Exceptional 93.0% |
| Tlingit-Haida | 99.8 /100 | #38 | Exceptional 93.0% |
| Immigrants | Austria | 99.8 /100 | #39 | Exceptional 93.0% |
| Turks | 99.8 /100 | #40 | Exceptional 93.0% |
| Bhutanese | 99.8 /100 | #41 | Exceptional 93.0% |
| Immigrants | Australia | 99.8 /100 | #42 | Exceptional 92.9% |
| Northern Europeans | 99.8 /100 | #43 | Exceptional 92.9% |