Immigrants from Scotland vs Immigrants from Albania Single Male Poverty

COMPARE

Immigrants from Scotland
Race
Ancestry
AfghanAfricanAlaska NativeAlaskan AthabascanAlbanianAleutAlsatianAmericanApacheArabArapahoArgentineanArmenianAssyrian/Chaldean/SyriacAustralianAustrianBahamianBangladeshiBarbadianBasqueBelgianBelizeanBermudanBhutaneseBlackfeetBolivianBrazilianBritishBritish West IndianBulgarianBurmeseCajunCambodianCanadianCape VerdeanCarpatho RusynCelticCentral AmericanCentral American IndianCherokeeCheyenneChickasawChileanChineseChippewaChoctawColombianColvilleComancheCosta RicanCreeCreekCroatianCrowCubanCypriotCzechCzechoslovakianDanishDelawareDominicanDutchDutch West IndianEastern EuropeanEcuadorianEgyptianEnglishEstonianEthiopianEuropeanFijianFilipinoFinnishFrenchFrench American IndianFrench CanadianGermanGerman RussianGhanaianGreekGuamanian/ChamorroGuatemalanGuyaneseHaitianHmongHonduranHopiHoumaHungarianIcelanderIndian (Asian)IndonesianInupiatIranianIraqiIrishIroquoisIsraeliItalianJamaicanJapaneseJordanianKenyanKiowaKoreanLaotianLatvianLebaneseLiberianLithuanianLumbeeLuxembourgerMacedonianMalaysianMalteseMarshalleseMenomineeMexicanMexican American IndianMongolianMoroccanNative HawaiianNavajoNepaleseNew ZealanderNicaraguanNigerianNorthern EuropeanNorwegianOkinawanOsageOttawaPaiutePakistaniPalestinianPanamanianParaguayanPennsylvania GermanPeruvianPimaPolishPortuguesePotawatomiPuebloPuerto RicanPuget Sound SalishRomanianRussianSalvadoranSamoanScandinavianScotch-IrishScottishSeminoleSenegaleseSerbianShoshoneSierra LeoneanSiouxSlavicSlovakSloveneSomaliSouth AfricanSouth AmericanSouth American IndianSoviet UnionSpaniardSpanishSpanish AmericanSpanish American IndianSri LankanSubsaharan AfricanSudaneseSwedishSwissSyrianTaiwaneseThaiTlingit-HaidaTohono O'OdhamTonganTrinidadian and TobagonianTsimshianTurkishU.S. Virgin IslanderUgandanUkrainianUruguayanUteVenezuelanVietnameseWelshWest IndianYakamaYaquiYugoslavianYumanYup'ikZimbabwean
Immigration
NonimmigrantsImmigrantsAfghanistanAfricaArgentinaArmeniaAsiaAustraliaAustriaBahamasBangladeshBarbadosBelarusBelgiumBelizeBoliviaBosnia and HerzegovinaBrazilBulgariaBurma/MyanmarCabo VerdeCambodiaCameroonCanadaCaribbeanCentral AmericaChileChinaColombiaCongoCosta RicaCroatiaCubaCzechoslovakiaDenmarkDominicaDominican RepublicEastern AfricaEastern AsiaEastern EuropeEcuadorEgyptEl SalvadorEnglandEritreaEthiopiaEuropeFijiFranceGermanyGhanaGreeceGrenadaGuatemalaGuyanaHaitiHondurasHong KongHungaryIndiaIndonesiaIranIraqIrelandIsraelItalyJamaicaJapanJordanKazakhstanKenyaKoreaKuwaitLaosLatin AmericaLatviaLebanonLiberiaLithuaniaMalaysiaMexicoMicronesiaMiddle AfricaMoldovaMoroccoNepalNetherlandsNicaraguaNigeriaNorth AmericaNorth MacedoniaNorthern AfricaNorthern EuropeNorwayOceaniaPakistanPanamaPeruPhilippinesPolandPortugalRomaniaRussiaSaudi ArabiaScotlandSenegalSerbiaSierra LeoneSingaporeSomaliaSouth AfricaSouth AmericaSouth Central AsiaSouth Eastern AsiaSouthern EuropeSpainSri LankaSt. Vincent and the GrenadinesSudanSwedenSwitzerlandSyriaTaiwanThailandTrinidad and TobagoTurkeyUgandaUkraineUruguayUzbekistanVenezuelaVietnamWest IndiesWestern AfricaWestern AsiaWestern EuropeYemenZaireZimbabweAzores
Immigrants from Albania
Race
Ancestry
AfghanAfricanAlaska NativeAlaskan AthabascanAlbanianAleutAlsatianAmericanApacheArabArapahoArgentineanArmenianAssyrian/Chaldean/SyriacAustralianAustrianBahamianBangladeshiBarbadianBasqueBelgianBelizeanBermudanBhutaneseBlackfeetBolivianBrazilianBritishBritish West IndianBulgarianBurmeseCajunCambodianCanadianCape VerdeanCarpatho RusynCelticCentral AmericanCentral American IndianCherokeeCheyenneChickasawChileanChineseChippewaChoctawColombianColvilleComancheCosta RicanCreeCreekCroatianCrowCubanCypriotCzechCzechoslovakianDanishDelawareDominicanDutchDutch West IndianEastern EuropeanEcuadorianEgyptianEnglishEstonianEthiopianEuropeanFijianFilipinoFinnishFrenchFrench American IndianFrench CanadianGermanGerman RussianGhanaianGreekGuamanian/ChamorroGuatemalanGuyaneseHaitianHmongHonduranHopiHoumaHungarianIcelanderIndian (Asian)IndonesianInupiatIranianIraqiIrishIroquoisIsraeliItalianJamaicanJapaneseJordanianKenyanKiowaKoreanLaotianLatvianLebaneseLiberianLithuanianLumbeeLuxembourgerMacedonianMalaysianMalteseMarshalleseMenomineeMexicanMexican American IndianMongolianMoroccanNative HawaiianNavajoNepaleseNew ZealanderNicaraguanNigerianNorthern EuropeanNorwegianOkinawanOsageOttawaPaiutePakistaniPalestinianPanamanianParaguayanPennsylvania GermanPeruvianPimaPolishPortuguesePotawatomiPuebloPuerto RicanPuget Sound SalishRomanianRussianSalvadoranSamoanScandinavianScotch-IrishScottishSeminoleSenegaleseSerbianShoshoneSierra LeoneanSiouxSlavicSlovakSloveneSomaliSouth AfricanSouth AmericanSouth American IndianSoviet UnionSpaniardSpanishSpanish AmericanSpanish American IndianSri LankanSubsaharan AfricanSudaneseSwedishSwissSyrianTaiwaneseThaiTlingit-HaidaTohono O'OdhamTonganTrinidadian and TobagonianTsimshianTurkishU.S. Virgin IslanderUgandanUkrainianUruguayanUteVenezuelanVietnameseWelshWest IndianYakamaYaquiYugoslavianYumanYup'ikZimbabwean
Immigration
NonimmigrantsImmigrantsAfghanistanAfricaAlbaniaArgentinaArmeniaAsiaAustraliaAustriaBahamasBangladeshBarbadosBelarusBelgiumBelizeBoliviaBosnia and HerzegovinaBrazilBulgariaBurma/MyanmarCabo VerdeCambodiaCameroonCanadaCaribbeanCentral AmericaChileChinaColombiaCongoCosta RicaCroatiaCubaCzechoslovakiaDenmarkDominicaDominican RepublicEastern AfricaEastern AsiaEastern EuropeEcuadorEgyptEl SalvadorEnglandEritreaEthiopiaEuropeFijiFranceGermanyGhanaGreeceGrenadaGuatemalaGuyanaHaitiHondurasHong KongHungaryIndiaIndonesiaIranIraqIrelandIsraelItalyJamaicaJapanJordanKazakhstanKenyaKoreaKuwaitLaosLatin AmericaLatviaLebanonLiberiaLithuaniaMalaysiaMexicoMicronesiaMiddle AfricaMoldovaMoroccoNepalNetherlandsNicaraguaNigeriaNorth AmericaNorth MacedoniaNorthern AfricaNorthern EuropeNorwayOceaniaPakistanPanamaPeruPhilippinesPolandPortugalRomaniaRussiaSaudi ArabiaSenegalSerbiaSierra LeoneSingaporeSomaliaSouth AfricaSouth AmericaSouth Central AsiaSouth Eastern AsiaSouthern EuropeSpainSri LankaSt. Vincent and the GrenadinesSudanSwedenSwitzerlandSyriaTaiwanThailandTrinidad and TobagoTurkeyUgandaUkraineUruguayUzbekistanVenezuelaVietnamWest IndiesWestern AfricaWestern AsiaWestern EuropeYemenZaireZimbabweAzores
Single Male Poverty
Income
Poverty
Unemployment
Labor Participation
Family Structure
Vehicle Availability
Education Level
Disability

Single Male Poverty Comparison

Immigrants from Scotland

Immigrants from Albania

Good
Exceptional
12.7%
SINGLE MALE POVERTY
68.9/ 100
METRIC RATING
154th/ 347
METRIC RANK
12.4%
SINGLE MALE POVERTY
90.3/ 100
METRIC RATING
119th/ 347
METRIC RANK

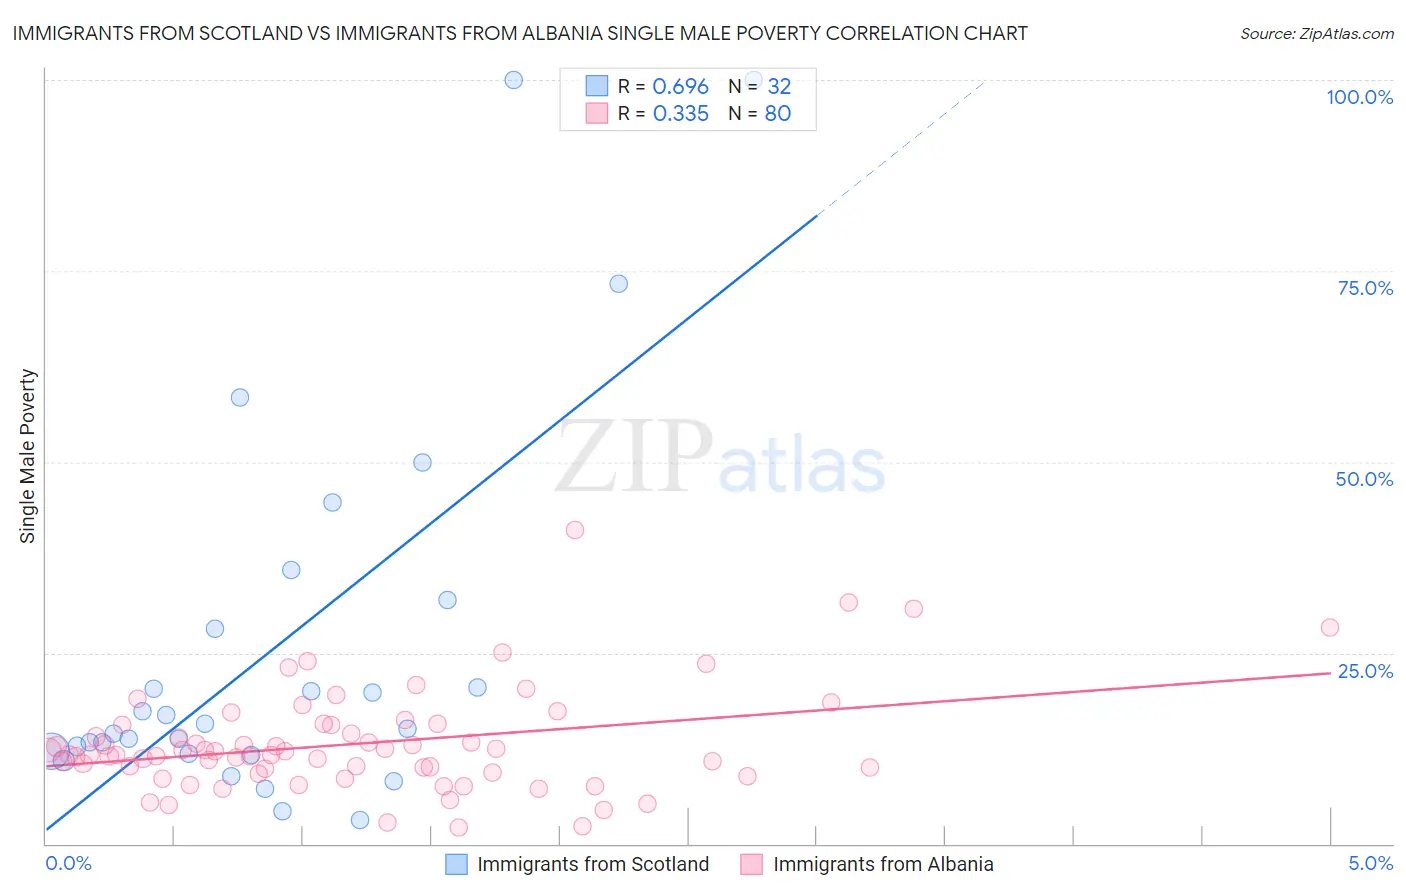
Immigrants from Scotland vs Immigrants from Albania Single Male Poverty Correlation Chart

The statistical analysis conducted on geographies consisting of 179,195,649 people shows a significant positive correlation between the proportion of Immigrants from Scotland and poverty level among single males in the United States with a correlation coefficient (R) of 0.696 and weighted average of 12.7%. Similarly, the statistical analysis conducted on geographies consisting of 110,814,842 people shows a mild positive correlation between the proportion of Immigrants from Albania and poverty level among single males in the United States with a correlation coefficient (R) of 0.335 and weighted average of 12.4%, a difference of 1.9%.
Immigrants from Scotland vs Immigrants from Albania Single Male Poverty

Single Male Poverty Correlation Summary

MeasurementImmigrants from ScotlandImmigrants from Albania
Minimum3.1%2.1%
Maximum100.0%41.0%
Range96.9%38.9%
Mean25.8%13.1%
Median15.4%11.7%
Interquartile 25% (IQ1)11.9%9.6%
Interquartile 75% (IQ3)30.0%15.5%
Interquartile Range (IQR)18.1%5.9%
Standard Deviation (Sample)25.1%6.7%
Standard Deviation (Population)24.7%6.6%

Similar Demographics by Single Male Poverty

Demographics Similar to Immigrants from Scotland by Single Male Poverty

In terms of single male poverty, the demographic groups most similar to Immigrants from Scotland are Immigrants from Spain (12.7%, a difference of 0.020%), Vietnamese (12.7%, a difference of 0.060%), Latvian (12.7%, a difference of 0.060%), Immigrants (12.7%, a difference of 0.070%), and Australian (12.6%, a difference of 0.16%).
DemographicsRating | RankSingle Male Poverty
Malaysians
74.8
/100
|
#147
Good
12.6%
Yugoslavians
73.9
/100
|
#148
Good
12.6%
Sierra Leoneans
73.0
/100
|
#149
Good
12.6%
Immigrants | Panama
72.1
/100
|
#150
Good
12.6%
Immigrants | Hungary
71.9
/100
|
#151
Good
12.6%
Australians
71.4
/100
|
#152
Good
12.6%
Immigrants | Immigrants
70.1
/100
|
#153
Good
12.7%
Immigrants | Scotland
68.9
/100
|
#154
Good
12.7%
Immigrants | Spain
68.7
/100
|
#155
Good
12.7%
Vietnamese
67.9
/100
|
#156
Good
12.7%
Latvians
67.9
/100
|
#157
Good
12.7%
Immigrants | Middle Africa
64.9
/100
|
#158
Good
12.7%
Immigrants | Liberia
64.2
/100
|
#159
Good
12.7%
Greeks
64.1
/100
|
#160
Good
12.7%
Immigrants | Africa
63.4
/100
|
#161
Good
12.7%

Demographics Similar to Immigrants from Albania by Single Male Poverty

In terms of single male poverty, the demographic groups most similar to Immigrants from Albania are Albanian (12.4%, a difference of 0.030%), Immigrants from Oceania (12.4%, a difference of 0.13%), Immigrants from Syria (12.4%, a difference of 0.14%), Venezuelan (12.4%, a difference of 0.14%), and Immigrants from Southern Europe (12.4%, a difference of 0.20%).
DemographicsRating | RankSingle Male Poverty
Kenyans
93.3
/100
|
#112
Exceptional
12.4%
Pakistanis
92.4
/100
|
#113
Exceptional
12.4%
Nicaraguans
92.1
/100
|
#114
Exceptional
12.4%
Immigrants | Southern Europe
91.5
/100
|
#115
Exceptional
12.4%
Immigrants | Syria
91.2
/100
|
#116
Exceptional
12.4%
Immigrants | Oceania
91.1
/100
|
#117
Exceptional
12.4%
Albanians
90.6
/100
|
#118
Exceptional
12.4%
Immigrants | Albania
90.3
/100
|
#119
Exceptional
12.4%
Venezuelans
89.4
/100
|
#120
Excellent
12.4%
Icelanders
88.2
/100
|
#121
Excellent
12.5%
Serbians
87.9
/100
|
#122
Excellent
12.5%
Immigrants | Kenya
87.6
/100
|
#123
Excellent
12.5%
Russians
87.3
/100
|
#124
Excellent
12.5%
Immigrants | Jordan
87.1
/100
|
#125
Excellent
12.5%
Romanians
86.4
/100
|
#126
Excellent
12.5%