Immigrants from Russia vs Salvadoran Single Mother Poverty
COMPARE
Immigrants from Russia
Salvadoran
Single Mother Poverty
Single Mother Poverty Comparison
Immigrants from Russia
Salvadorans
27.4%
SINGLE MOTHER POVERTY
99.4/ 100
METRIC RATING
72nd/ 347
METRIC RANK
30.6%
SINGLE MOTHER POVERTY
1.8/ 100
METRIC RATING
240th/ 347
METRIC RANK
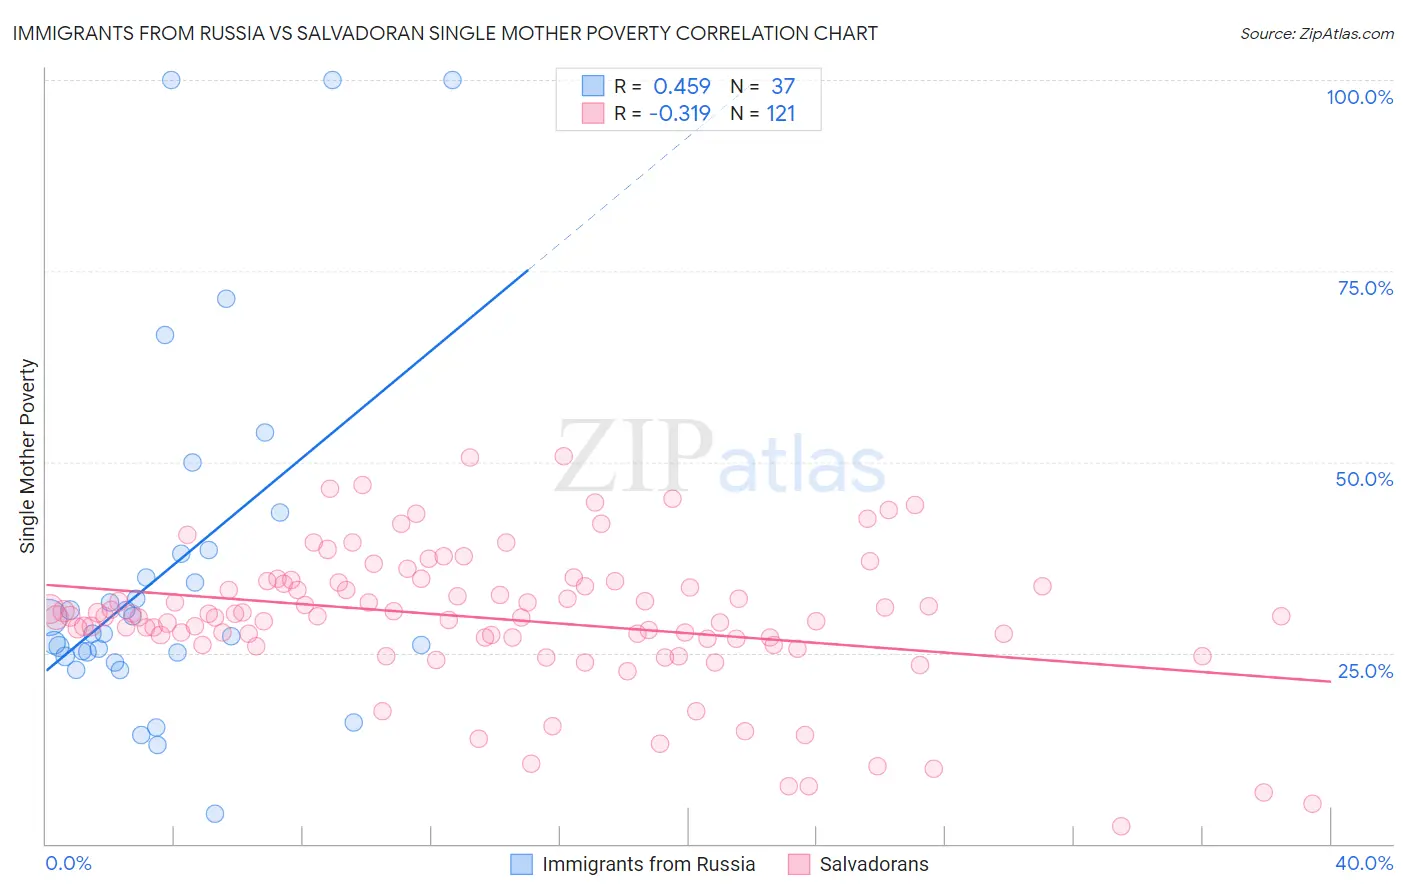
Immigrants from Russia vs Salvadoran Single Mother Poverty Correlation Chart
The statistical analysis conducted on geographies consisting of 339,121,239 people shows a moderate positive correlation between the proportion of Immigrants from Russia and poverty level among single mothers in the United States with a correlation coefficient (R) of 0.459 and weighted average of 27.4%. Similarly, the statistical analysis conducted on geographies consisting of 391,766,529 people shows a mild negative correlation between the proportion of Salvadorans and poverty level among single mothers in the United States with a correlation coefficient (R) of -0.319 and weighted average of 30.6%, a difference of 11.5%.
Single Mother Poverty Correlation Summary
| Measurement | Immigrants from Russia | Salvadoran |
| Minimum | 3.9% | 2.2% |
| Maximum | 100.0% | 50.7% |
| Range | 96.1% | 48.5% |
| Mean | 36.0% | 29.5% |
| Median | 27.5% | 29.8% |
| Interquartile 25% (IQ1) | 24.8% | 26.8% |
| Interquartile 75% (IQ3) | 38.2% | 34.2% |
| Interquartile Range (IQR) | 13.4% | 7.3% |
| Standard Deviation (Sample) | 23.4% | 9.2% |
| Standard Deviation (Population) | 23.1% | 9.1% |
Similar Demographics by Single Mother Poverty
Demographics Similar to Immigrants from Russia by Single Mother Poverty
In terms of single mother poverty, the demographic groups most similar to Immigrants from Russia are Macedonian (27.4%, a difference of 0.020%), Immigrants from Belarus (27.4%, a difference of 0.040%), Lithuanian (27.4%, a difference of 0.060%), Sierra Leonean (27.4%, a difference of 0.060%), and Immigrants from Europe (27.4%, a difference of 0.13%).
| Demographics | Rating | Rank | Single Mother Poverty |
| Immigrants | Turkey | 99.5 /100 | #65 | Exceptional 27.3% |
| Soviet Union | 99.5 /100 | #66 | Exceptional 27.3% |
| Immigrants | Australia | 99.5 /100 | #67 | Exceptional 27.3% |
| Immigrants | Czechoslovakia | 99.5 /100 | #68 | Exceptional 27.4% |
| Lithuanians | 99.4 /100 | #69 | Exceptional 27.4% |
| Immigrants | Belarus | 99.4 /100 | #70 | Exceptional 27.4% |
| Macedonians | 99.4 /100 | #71 | Exceptional 27.4% |
| Immigrants | Russia | 99.4 /100 | #72 | Exceptional 27.4% |
| Sierra Leoneans | 99.3 /100 | #73 | Exceptional 27.4% |
| Immigrants | Europe | 99.3 /100 | #74 | Exceptional 27.4% |
| Immigrants | Sweden | 99.2 /100 | #75 | Exceptional 27.5% |
| Peruvians | 99.2 /100 | #76 | Exceptional 27.5% |
| Immigrants | Peru | 99.2 /100 | #77 | Exceptional 27.5% |
| Immigrants | North Macedonia | 99.2 /100 | #78 | Exceptional 27.5% |
| Immigrants | Italy | 99.1 /100 | #79 | Exceptional 27.5% |
Demographics Similar to Salvadorans by Single Mother Poverty
In terms of single mother poverty, the demographic groups most similar to Salvadorans are Immigrants from Laos (30.6%, a difference of 0.050%), Immigrants from Burma/Myanmar (30.6%, a difference of 0.070%), Immigrants from Portugal (30.5%, a difference of 0.13%), Bermudan (30.6%, a difference of 0.15%), and French (30.7%, a difference of 0.37%).
| Demographics | Rating | Rank | Single Mother Poverty |
| Immigrants | Middle Africa | 3.5 /100 | #233 | Tragic 30.3% |
| Immigrants | Nicaragua | 3.5 /100 | #234 | Tragic 30.3% |
| Immigrants | Grenada | 3.4 /100 | #235 | Tragic 30.3% |
| Welsh | 3.2 /100 | #236 | Tragic 30.4% |
| Immigrants | St. Vincent and the Grenadines | 3.1 /100 | #237 | Tragic 30.4% |
| Slovaks | 2.8 /100 | #238 | Tragic 30.4% |
| Immigrants | Portugal | 2.1 /100 | #239 | Tragic 30.5% |
| Salvadorans | 1.8 /100 | #240 | Tragic 30.6% |
| Immigrants | Laos | 1.8 /100 | #241 | Tragic 30.6% |
| Immigrants | Burma/Myanmar | 1.7 /100 | #242 | Tragic 30.6% |
| Bermudans | 1.6 /100 | #243 | Tragic 30.6% |
| French | 1.3 /100 | #244 | Tragic 30.7% |
| Barbadians | 1.3 /100 | #245 | Tragic 30.7% |
| Ecuadorians | 0.9 /100 | #246 | Tragic 30.8% |
| West Indians | 0.9 /100 | #247 | Tragic 30.8% |