Immigrants from Romania vs Immigrants from Bosnia and Herzegovina Child Poverty Among Boys Under 16
COMPARE
Immigrants from Romania
Immigrants from Bosnia and Herzegovina
Child Poverty Among Boys Under 16
Child Poverty Among Boys Under 16 Comparison
Immigrants from Romania
Immigrants from Bosnia and Herzegovina
14.5%
CHILD POVERTY AMONG BOYS UNDER 16
98.5/ 100
METRIC RATING
64th/ 347
METRIC RANK
16.4%
CHILD POVERTY AMONG BOYS UNDER 16
51.7/ 100
METRIC RATING
170th/ 347
METRIC RANK
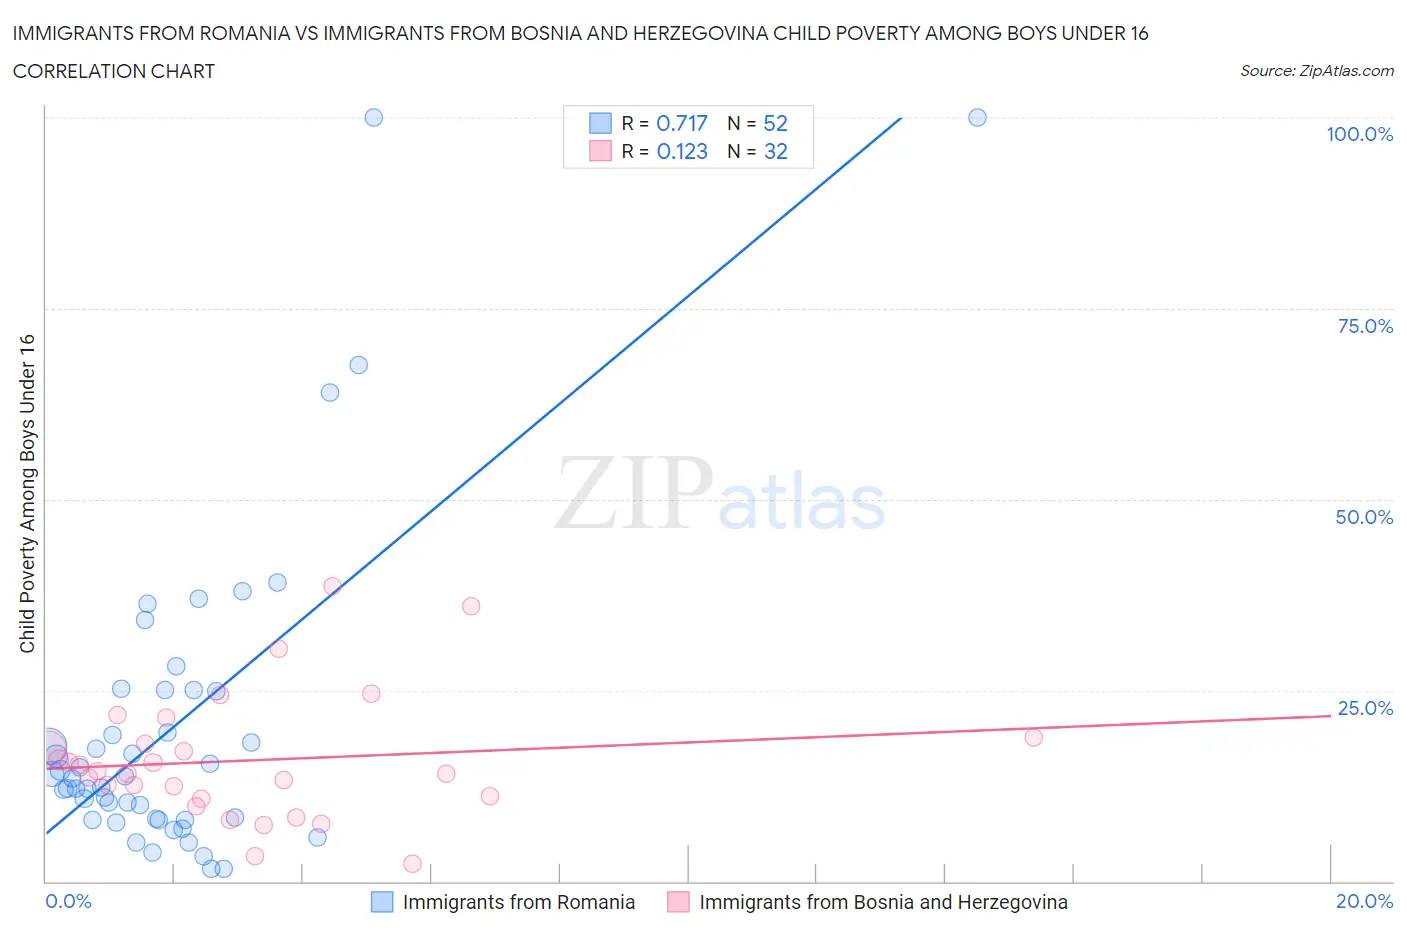
Immigrants from Romania vs Immigrants from Bosnia and Herzegovina Child Poverty Among Boys Under 16 Correlation Chart
The statistical analysis conducted on geographies consisting of 253,981,907 people shows a strong positive correlation between the proportion of Immigrants from Romania and poverty level among boys under the age of 16 in the United States with a correlation coefficient (R) of 0.717 and weighted average of 14.5%. Similarly, the statistical analysis conducted on geographies consisting of 155,858,187 people shows a poor positive correlation between the proportion of Immigrants from Bosnia and Herzegovina and poverty level among boys under the age of 16 in the United States with a correlation coefficient (R) of 0.123 and weighted average of 16.4%, a difference of 12.9%.
Child Poverty Among Boys Under 16 Correlation Summary
| Measurement | Immigrants from Romania | Immigrants from Bosnia and Herzegovina |
| Minimum | 1.6% | 2.4% |
| Maximum | 100.0% | 38.5% |
| Range | 98.4% | 36.2% |
| Mean | 20.3% | 15.8% |
| Median | 13.6% | 14.3% |
| Interquartile 25% (IQ1) | 8.1% | 11.0% |
| Interquartile 75% (IQ3) | 24.9% | 18.4% |
| Interquartile Range (IQR) | 16.8% | 7.4% |
| Standard Deviation (Sample) | 21.1% | 8.2% |
| Standard Deviation (Population) | 20.9% | 8.1% |
Similar Demographics by Child Poverty Among Boys Under 16
Demographics Similar to Immigrants from Romania by Child Poverty Among Boys Under 16
In terms of child poverty among boys under 16, the demographic groups most similar to Immigrants from Romania are Soviet Union (14.5%, a difference of 0.030%), Immigrants from Bulgaria (14.5%, a difference of 0.030%), Immigrants from Europe (14.5%, a difference of 0.060%), Cambodian (14.5%, a difference of 0.13%), and Slovene (14.5%, a difference of 0.15%).
| Demographics | Rating | Rank | Child Poverty Among Boys Under 16 |
| Poles | 98.9 /100 | #57 | Exceptional 14.4% |
| Immigrants | Sweden | 98.9 /100 | #58 | Exceptional 14.4% |
| Immigrants | Czechoslovakia | 98.9 /100 | #59 | Exceptional 14.4% |
| Immigrants | Belgium | 98.9 /100 | #60 | Exceptional 14.4% |
| Scandinavians | 98.8 /100 | #61 | Exceptional 14.4% |
| Immigrants | Israel | 98.7 /100 | #62 | Exceptional 14.4% |
| Cambodians | 98.5 /100 | #63 | Exceptional 14.5% |
| Immigrants | Romania | 98.5 /100 | #64 | Exceptional 14.5% |
| Soviet Union | 98.5 /100 | #65 | Exceptional 14.5% |
| Immigrants | Bulgaria | 98.5 /100 | #66 | Exceptional 14.5% |
| Immigrants | Europe | 98.4 /100 | #67 | Exceptional 14.5% |
| Slovenes | 98.4 /100 | #68 | Exceptional 14.5% |
| Immigrants | Austria | 98.4 /100 | #69 | Exceptional 14.5% |
| Europeans | 98.4 /100 | #70 | Exceptional 14.5% |
| Immigrants | Netherlands | 98.1 /100 | #71 | Exceptional 14.6% |
Demographics Similar to Immigrants from Bosnia and Herzegovina by Child Poverty Among Boys Under 16
In terms of child poverty among boys under 16, the demographic groups most similar to Immigrants from Bosnia and Herzegovina are Immigrants from Ethiopia (16.4%, a difference of 0.050%), Immigrants from Colombia (16.4%, a difference of 0.11%), Tsimshian (16.4%, a difference of 0.14%), Uruguayan (16.4%, a difference of 0.19%), and Immigrants from Saudi Arabia (16.4%, a difference of 0.21%).
| Demographics | Rating | Rank | Child Poverty Among Boys Under 16 |
| Costa Ricans | 68.1 /100 | #163 | Good 16.1% |
| Immigrants | Albania | 67.9 /100 | #164 | Good 16.1% |
| Colombians | 65.2 /100 | #165 | Good 16.1% |
| Immigrants | Germany | 63.6 /100 | #166 | Good 16.2% |
| Afghans | 55.4 /100 | #167 | Average 16.3% |
| South Americans | 55.3 /100 | #168 | Average 16.3% |
| Immigrants | Saudi Arabia | 53.6 /100 | #169 | Average 16.4% |
| Immigrants | Bosnia and Herzegovina | 51.7 /100 | #170 | Average 16.4% |
| Immigrants | Ethiopia | 51.3 /100 | #171 | Average 16.4% |
| Immigrants | Colombia | 50.8 /100 | #172 | Average 16.4% |
| Tsimshian | 50.5 /100 | #173 | Average 16.4% |
| Uruguayans | 50.0 /100 | #174 | Average 16.4% |
| Immigrants | Syria | 49.0 /100 | #175 | Average 16.5% |
| Whites/Caucasians | 48.2 /100 | #176 | Average 16.5% |
| Ethiopians | 47.8 /100 | #177 | Average 16.5% |