Immigrants from Poland vs Scotch-Irish Child Poverty Among Girls Under 16
COMPARE
Immigrants from Poland
Scotch-Irish
Child Poverty Among Girls Under 16
Child Poverty Among Girls Under 16 Comparison
Immigrants from Poland
Scotch-Irish
14.6%
CHILD POVERTY AMONG GIRLS UNDER 16
98.2/ 100
METRIC RATING
69th/ 347
METRIC RANK
16.7%
CHILD POVERTY AMONG GIRLS UNDER 16
39.6/ 100
METRIC RATING
184th/ 347
METRIC RANK
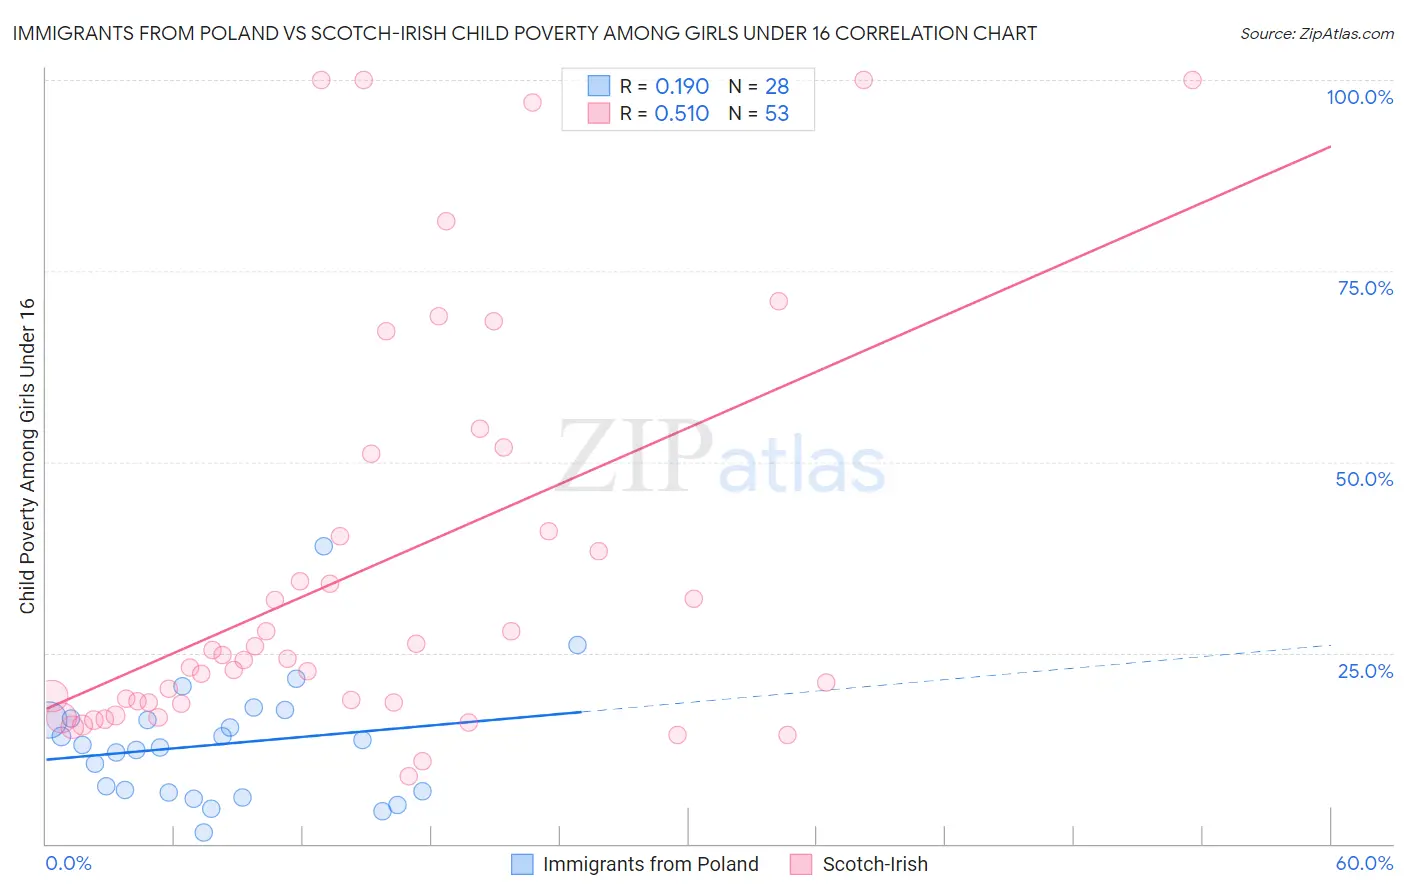
Immigrants from Poland vs Scotch-Irish Child Poverty Among Girls Under 16 Correlation Chart
The statistical analysis conducted on geographies consisting of 299,095,892 people shows a poor positive correlation between the proportion of Immigrants from Poland and poverty level among girls under the age of 16 in the United States with a correlation coefficient (R) of 0.190 and weighted average of 14.6%. Similarly, the statistical analysis conducted on geographies consisting of 529,237,473 people shows a substantial positive correlation between the proportion of Scotch-Irish and poverty level among girls under the age of 16 in the United States with a correlation coefficient (R) of 0.510 and weighted average of 16.7%, a difference of 14.3%.
Child Poverty Among Girls Under 16 Correlation Summary
| Measurement | Immigrants from Poland | Scotch-Irish |
| Minimum | 1.5% | 8.9% |
| Maximum | 39.0% | 100.0% |
| Range | 37.4% | 91.1% |
| Mean | 13.0% | 36.0% |
| Median | 12.8% | 24.2% |
| Interquartile 25% (IQ1) | 6.8% | 18.5% |
| Interquartile 75% (IQ3) | 16.3% | 46.0% |
| Interquartile Range (IQR) | 9.5% | 27.6% |
| Standard Deviation (Sample) | 7.8% | 26.7% |
| Standard Deviation (Population) | 7.7% | 26.4% |
Similar Demographics by Child Poverty Among Girls Under 16
Demographics Similar to Immigrants from Poland by Child Poverty Among Girls Under 16
In terms of child poverty among girls under 16, the demographic groups most similar to Immigrants from Poland are European (14.6%, a difference of 0.12%), Immigrants from Argentina (14.6%, a difference of 0.16%), Slovene (14.6%, a difference of 0.16%), Immigrants from Netherlands (14.6%, a difference of 0.19%), and Immigrants from Austria (14.6%, a difference of 0.28%).
| Demographics | Rating | Rank | Child Poverty Among Girls Under 16 |
| Scandinavians | 98.7 /100 | #62 | Exceptional 14.4% |
| Immigrants | Europe | 98.7 /100 | #63 | Exceptional 14.4% |
| Immigrants | Philippines | 98.6 /100 | #64 | Exceptional 14.4% |
| Immigrants | Sweden | 98.6 /100 | #65 | Exceptional 14.5% |
| Immigrants | Belgium | 98.5 /100 | #66 | Exceptional 14.5% |
| Laotians | 98.4 /100 | #67 | Exceptional 14.5% |
| Immigrants | Argentina | 98.3 /100 | #68 | Exceptional 14.6% |
| Immigrants | Poland | 98.2 /100 | #69 | Exceptional 14.6% |
| Europeans | 98.1 /100 | #70 | Exceptional 14.6% |
| Slovenes | 98.1 /100 | #71 | Exceptional 14.6% |
| Immigrants | Netherlands | 98.1 /100 | #72 | Exceptional 14.6% |
| Immigrants | Austria | 98.0 /100 | #73 | Exceptional 14.6% |
| Taiwanese | 98.0 /100 | #74 | Exceptional 14.6% |
| Immigrants | Eastern Europe | 98.0 /100 | #75 | Exceptional 14.6% |
| Immigrants | Russia | 97.9 /100 | #76 | Exceptional 14.7% |
Demographics Similar to Scotch-Irish by Child Poverty Among Girls Under 16
In terms of child poverty among girls under 16, the demographic groups most similar to Scotch-Irish are Immigrants from Portugal (16.6%, a difference of 0.34%), Immigrants from Ethiopia (16.6%, a difference of 0.41%), Immigrants from Iraq (16.6%, a difference of 0.42%), Immigrants from Syria (16.6%, a difference of 0.44%), and Hawaiian (16.6%, a difference of 0.45%).
| Demographics | Rating | Rank | Child Poverty Among Girls Under 16 |
| Immigrants | Western Asia | 44.1 /100 | #177 | Average 16.6% |
| Whites/Caucasians | 43.6 /100 | #178 | Average 16.6% |
| Hawaiians | 43.4 /100 | #179 | Average 16.6% |
| Immigrants | Syria | 43.3 /100 | #180 | Average 16.6% |
| Immigrants | Iraq | 43.2 /100 | #181 | Average 16.6% |
| Immigrants | Ethiopia | 43.1 /100 | #182 | Average 16.6% |
| Immigrants | Portugal | 42.5 /100 | #183 | Average 16.6% |
| Scotch-Irish | 39.6 /100 | #184 | Fair 16.7% |
| Immigrants | Uruguay | 35.6 /100 | #185 | Fair 16.7% |
| South American Indians | 35.0 /100 | #186 | Fair 16.8% |
| Immigrants | Morocco | 34.6 /100 | #187 | Fair 16.8% |
| Arabs | 34.5 /100 | #188 | Fair 16.8% |
| Immigrants | Bosnia and Herzegovina | 32.5 /100 | #189 | Fair 16.8% |
| Kenyans | 32.3 /100 | #190 | Fair 16.8% |
| Immigrants | Azores | 31.3 /100 | #191 | Fair 16.8% |