Immigrants from Poland vs Immigrants from Greece Child Poverty Under the Age of 16
COMPARE
Immigrants from Poland
Immigrants from Greece
Child Poverty Under the Age of 16
Child Poverty Under the Age of 16 Comparison
Immigrants from Poland
Immigrants from Greece
14.3%
CHILD POVERTY UNDER THE AGE OF 16
97.9/ 100
METRIC RATING
71st/ 347
METRIC RANK
13.9%
CHILD POVERTY UNDER THE AGE OF 16
99.1/ 100
METRIC RATING
51st/ 347
METRIC RANK
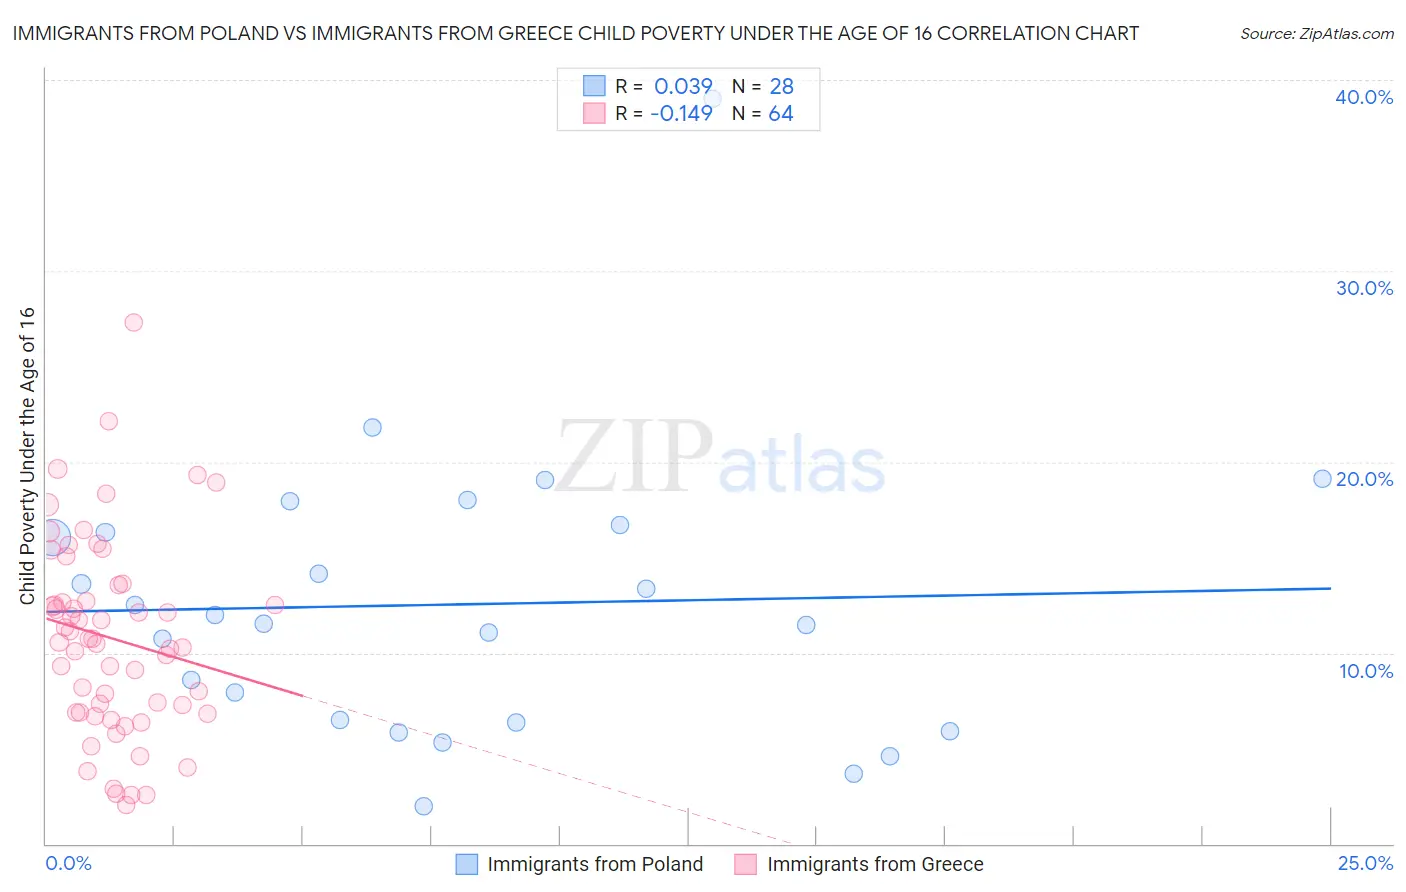
Immigrants from Poland vs Immigrants from Greece Child Poverty Under the Age of 16 Correlation Chart
The statistical analysis conducted on geographies consisting of 301,862,238 people shows no correlation between the proportion of Immigrants from Poland and poverty level among children under the age of 16 in the United States with a correlation coefficient (R) of 0.039 and weighted average of 14.3%. Similarly, the statistical analysis conducted on geographies consisting of 215,141,811 people shows a poor negative correlation between the proportion of Immigrants from Greece and poverty level among children under the age of 16 in the United States with a correlation coefficient (R) of -0.149 and weighted average of 13.9%, a difference of 2.9%.
Child Poverty Under the Age of 16 Correlation Summary
| Measurement | Immigrants from Poland | Immigrants from Greece |
| Minimum | 2.0% | 2.0% |
| Maximum | 39.0% | 27.3% |
| Range | 37.1% | 25.3% |
| Mean | 12.5% | 10.8% |
| Median | 11.8% | 10.6% |
| Interquartile 25% (IQ1) | 6.4% | 6.9% |
| Interquartile 75% (IQ3) | 16.5% | 13.1% |
| Interquartile Range (IQR) | 10.1% | 6.2% |
| Standard Deviation (Sample) | 7.4% | 5.1% |
| Standard Deviation (Population) | 7.3% | 5.1% |
Demographics Similar to Immigrants from Poland and Immigrants from Greece by Child Poverty Under the Age of 16
In terms of child poverty under the age of 16, the demographic groups most similar to Immigrants from Poland are Immigrants from Netherlands (14.3%, a difference of 0.0%), Immigrants from Bulgaria (14.3%, a difference of 0.11%), Laotian (14.3%, a difference of 0.18%), European (14.3%, a difference of 0.28%), and Slovene (14.3%, a difference of 0.32%). Similarly, the demographic groups most similar to Immigrants from Greece are Polish (14.0%, a difference of 0.76%), Immigrants from Israel (14.1%, a difference of 1.1%), Tsimshian (14.1%, a difference of 1.1%), Immigrants from Indonesia (14.1%, a difference of 1.2%), and Immigrants from Serbia (14.1%, a difference of 1.3%).
| Demographics | Rating | Rank | Child Poverty Under the Age of 16 |
| Immigrants | Greece | 99.1 /100 | #51 | Exceptional 13.9% |
| Poles | 98.9 /100 | #52 | Exceptional 14.0% |
| Immigrants | Israel | 98.8 /100 | #53 | Exceptional 14.1% |
| Tsimshian | 98.8 /100 | #54 | Exceptional 14.1% |
| Immigrants | Indonesia | 98.7 /100 | #55 | Exceptional 14.1% |
| Immigrants | Serbia | 98.7 /100 | #56 | Exceptional 14.1% |
| Immigrants | Belgium | 98.6 /100 | #57 | Exceptional 14.1% |
| Immigrants | Pakistan | 98.6 /100 | #58 | Exceptional 14.1% |
| Scandinavians | 98.6 /100 | #59 | Exceptional 14.1% |
| Immigrants | Austria | 98.5 /100 | #60 | Exceptional 14.2% |
| Immigrants | Sweden | 98.5 /100 | #61 | Exceptional 14.2% |
| Zimbabweans | 98.5 /100 | #62 | Exceptional 14.2% |
| Immigrants | Europe | 98.4 /100 | #63 | Exceptional 14.2% |
| Immigrants | Romania | 98.3 /100 | #64 | Exceptional 14.2% |
| Immigrants | Philippines | 98.2 /100 | #65 | Exceptional 14.3% |
| Slovenes | 98.1 /100 | #66 | Exceptional 14.3% |
| Europeans | 98.1 /100 | #67 | Exceptional 14.3% |
| Laotians | 98.0 /100 | #68 | Exceptional 14.3% |
| Immigrants | Bulgaria | 98.0 /100 | #69 | Exceptional 14.3% |
| Immigrants | Netherlands | 97.9 /100 | #70 | Exceptional 14.3% |
| Immigrants | Poland | 97.9 /100 | #71 | Exceptional 14.3% |