Assyrian/Chaldean/Syriac vs Immigrants from Greece Child Poverty Under the Age of 16
COMPARE
Assyrian/Chaldean/Syriac
Immigrants from Greece
Child Poverty Under the Age of 16
Child Poverty Under the Age of 16 Comparison
Assyrians/Chaldeans/Syriacs
Immigrants from Greece
13.3%
CHILD POVERTY UNDER THE AGE OF 16
99.7/ 100
METRIC RATING
28th/ 347
METRIC RANK
13.9%
CHILD POVERTY UNDER THE AGE OF 16
99.1/ 100
METRIC RATING
51st/ 347
METRIC RANK
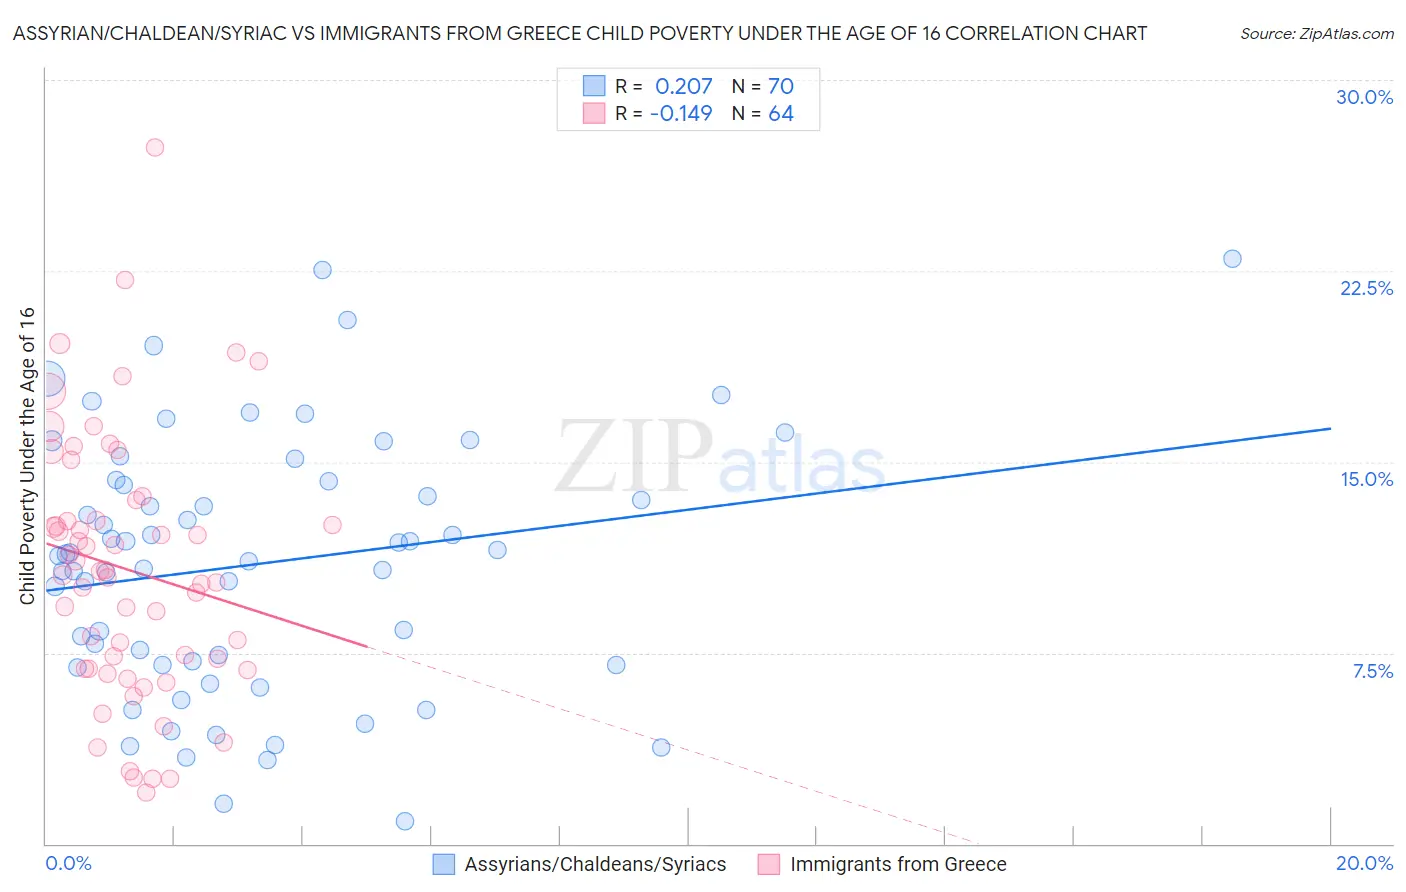
Assyrian/Chaldean/Syriac vs Immigrants from Greece Child Poverty Under the Age of 16 Correlation Chart
The statistical analysis conducted on geographies consisting of 109,836,821 people shows a weak positive correlation between the proportion of Assyrians/Chaldeans/Syriacs and poverty level among children under the age of 16 in the United States with a correlation coefficient (R) of 0.207 and weighted average of 13.3%. Similarly, the statistical analysis conducted on geographies consisting of 215,141,811 people shows a poor negative correlation between the proportion of Immigrants from Greece and poverty level among children under the age of 16 in the United States with a correlation coefficient (R) of -0.149 and weighted average of 13.9%, a difference of 4.6%.
Child Poverty Under the Age of 16 Correlation Summary
| Measurement | Assyrian/Chaldean/Syriac | Immigrants from Greece |
| Minimum | 0.91% | 2.0% |
| Maximum | 23.0% | 27.3% |
| Range | 22.1% | 25.3% |
| Mean | 11.0% | 10.8% |
| Median | 11.3% | 10.6% |
| Interquartile 25% (IQ1) | 7.0% | 6.9% |
| Interquartile 75% (IQ3) | 14.2% | 13.1% |
| Interquartile Range (IQR) | 7.2% | 6.2% |
| Standard Deviation (Sample) | 5.0% | 5.1% |
| Standard Deviation (Population) | 5.0% | 5.1% |
Similar Demographics by Child Poverty Under the Age of 16
Demographics Similar to Assyrians/Chaldeans/Syriacs by Child Poverty Under the Age of 16
In terms of child poverty under the age of 16, the demographic groups most similar to Assyrians/Chaldeans/Syriacs are Swedish (13.3%, a difference of 0.18%), Immigrants from China (13.3%, a difference of 0.24%), Turkish (13.4%, a difference of 0.48%), Bolivian (13.2%, a difference of 0.53%), and Danish (13.4%, a difference of 0.68%).
| Demographics | Rating | Rank | Child Poverty Under the Age of 16 |
| Immigrants | Eastern Asia | 99.8 /100 | #21 | Exceptional 13.1% |
| Maltese | 99.8 /100 | #22 | Exceptional 13.1% |
| Indians (Asian) | 99.8 /100 | #23 | Exceptional 13.1% |
| Latvians | 99.8 /100 | #24 | Exceptional 13.2% |
| Eastern Europeans | 99.8 /100 | #25 | Exceptional 13.2% |
| Bolivians | 99.8 /100 | #26 | Exceptional 13.2% |
| Immigrants | China | 99.8 /100 | #27 | Exceptional 13.3% |
| Assyrians/Chaldeans/Syriacs | 99.7 /100 | #28 | Exceptional 13.3% |
| Swedes | 99.7 /100 | #29 | Exceptional 13.3% |
| Turks | 99.7 /100 | #30 | Exceptional 13.4% |
| Danes | 99.7 /100 | #31 | Exceptional 13.4% |
| Tongans | 99.7 /100 | #32 | Exceptional 13.4% |
| Asians | 99.6 /100 | #33 | Exceptional 13.5% |
| Russians | 99.6 /100 | #34 | Exceptional 13.5% |
| Lithuanians | 99.6 /100 | #35 | Exceptional 13.5% |
Demographics Similar to Immigrants from Greece by Child Poverty Under the Age of 16
In terms of child poverty under the age of 16, the demographic groups most similar to Immigrants from Greece are Immigrants from Czechoslovakia (13.9%, a difference of 0.12%), Italian (13.9%, a difference of 0.35%), Korean (13.9%, a difference of 0.38%), Estonian (13.9%, a difference of 0.44%), and Immigrants from Asia (13.8%, a difference of 0.60%).
| Demographics | Rating | Rank | Child Poverty Under the Age of 16 |
| Greeks | 99.3 /100 | #44 | Exceptional 13.8% |
| Czechs | 99.3 /100 | #45 | Exceptional 13.8% |
| Immigrants | Asia | 99.2 /100 | #46 | Exceptional 13.8% |
| Estonians | 99.2 /100 | #47 | Exceptional 13.9% |
| Koreans | 99.2 /100 | #48 | Exceptional 13.9% |
| Italians | 99.2 /100 | #49 | Exceptional 13.9% |
| Immigrants | Czechoslovakia | 99.1 /100 | #50 | Exceptional 13.9% |
| Immigrants | Greece | 99.1 /100 | #51 | Exceptional 13.9% |
| Poles | 98.9 /100 | #52 | Exceptional 14.0% |
| Immigrants | Israel | 98.8 /100 | #53 | Exceptional 14.1% |
| Tsimshian | 98.8 /100 | #54 | Exceptional 14.1% |
| Immigrants | Indonesia | 98.7 /100 | #55 | Exceptional 14.1% |
| Immigrants | Serbia | 98.7 /100 | #56 | Exceptional 14.1% |
| Immigrants | Belgium | 98.6 /100 | #57 | Exceptional 14.1% |
| Immigrants | Pakistan | 98.6 /100 | #58 | Exceptional 14.1% |