Immigrants from Peru vs Turkish Seniors Poverty Over the Age of 75
COMPARE
Immigrants from Peru
Turkish
Seniors Poverty Over the Age of 75
Seniors Poverty Over the Age of 75 Comparison
Immigrants from Peru
Turks
13.7%
SENIORS POVERTY OVER THE AGE OF 75
0.3/ 100
METRIC RATING
251st/ 347
METRIC RANK
11.7%
SENIORS POVERTY OVER THE AGE OF 75
89.4/ 100
METRIC RATING
108th/ 347
METRIC RANK
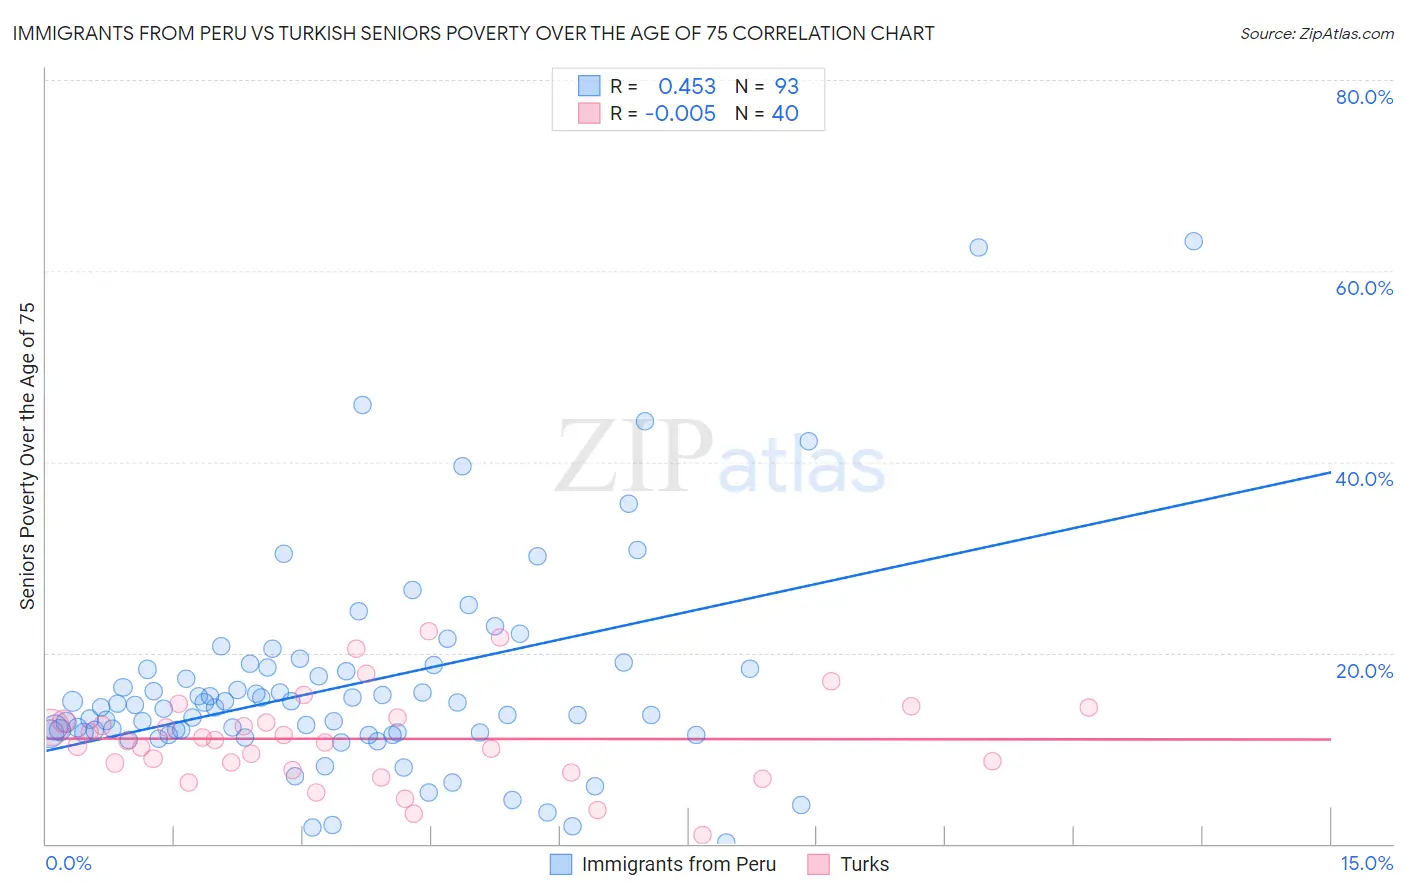
Immigrants from Peru vs Turkish Seniors Poverty Over the Age of 75 Correlation Chart
The statistical analysis conducted on geographies consisting of 326,168,143 people shows a moderate positive correlation between the proportion of Immigrants from Peru and poverty level among seniors over the age of 75 in the United States with a correlation coefficient (R) of 0.453 and weighted average of 13.7%. Similarly, the statistical analysis conducted on geographies consisting of 269,414,533 people shows no correlation between the proportion of Turks and poverty level among seniors over the age of 75 in the United States with a correlation coefficient (R) of -0.005 and weighted average of 11.7%, a difference of 17.1%.
Seniors Poverty Over the Age of 75 Correlation Summary
| Measurement | Immigrants from Peru | Turkish |
| Minimum | 0.17% | 0.93% |
| Maximum | 63.2% | 22.3% |
| Range | 63.0% | 21.4% |
| Mean | 16.6% | 11.0% |
| Median | 14.3% | 10.8% |
| Interquartile 25% (IQ1) | 11.6% | 8.1% |
| Interquartile 75% (IQ3) | 18.4% | 13.0% |
| Interquartile Range (IQR) | 6.8% | 4.9% |
| Standard Deviation (Sample) | 11.0% | 4.8% |
| Standard Deviation (Population) | 10.9% | 4.7% |
Similar Demographics by Seniors Poverty Over the Age of 75
Demographics Similar to Immigrants from Peru by Seniors Poverty Over the Age of 75
In terms of seniors poverty over the age of 75, the demographic groups most similar to Immigrants from Peru are Immigrants from Argentina (13.7%, a difference of 0.050%), Immigrants from Spain (13.7%, a difference of 0.27%), Mexican American Indian (13.6%, a difference of 0.33%), Immigrants from Albania (13.6%, a difference of 0.34%), and African (13.6%, a difference of 0.35%).
| Demographics | Rating | Rank | Seniors Poverty Over the Age of 75 |
| Spanish Americans | 0.5 /100 | #244 | Tragic 13.5% |
| Uruguayans | 0.5 /100 | #245 | Tragic 13.5% |
| Immigrants | Cambodia | 0.4 /100 | #246 | Tragic 13.6% |
| Immigrants | Ukraine | 0.3 /100 | #247 | Tragic 13.6% |
| Africans | 0.3 /100 | #248 | Tragic 13.6% |
| Immigrants | Albania | 0.3 /100 | #249 | Tragic 13.6% |
| Mexican American Indians | 0.3 /100 | #250 | Tragic 13.6% |
| Immigrants | Peru | 0.3 /100 | #251 | Tragic 13.7% |
| Immigrants | Argentina | 0.3 /100 | #252 | Tragic 13.7% |
| Immigrants | Spain | 0.2 /100 | #253 | Tragic 13.7% |
| Blackfeet | 0.2 /100 | #254 | Tragic 13.7% |
| Immigrants | Belarus | 0.2 /100 | #255 | Tragic 13.8% |
| Inupiat | 0.1 /100 | #256 | Tragic 13.8% |
| Immigrants | Western Africa | 0.1 /100 | #257 | Tragic 13.9% |
| Immigrants | Panama | 0.1 /100 | #258 | Tragic 13.9% |
Demographics Similar to Turks by Seniors Poverty Over the Age of 75
In terms of seniors poverty over the age of 75, the demographic groups most similar to Turks are South African (11.7%, a difference of 0.0%), Immigrants from Oceania (11.7%, a difference of 0.010%), Russian (11.6%, a difference of 0.12%), Immigrants from Jordan (11.7%, a difference of 0.15%), and Burmese (11.7%, a difference of 0.15%).
| Demographics | Rating | Rank | Seniors Poverty Over the Age of 75 |
| Jordanians | 90.8 /100 | #101 | Exceptional 11.6% |
| Guamanians/Chamorros | 90.6 /100 | #102 | Exceptional 11.6% |
| Immigrants | Kuwait | 90.5 /100 | #103 | Exceptional 11.6% |
| Immigrants | Singapore | 90.3 /100 | #104 | Exceptional 11.6% |
| Chickasaw | 90.2 /100 | #105 | Exceptional 11.6% |
| Russians | 89.9 /100 | #106 | Excellent 11.6% |
| Immigrants | Oceania | 89.4 /100 | #107 | Excellent 11.7% |
| Turks | 89.4 /100 | #108 | Excellent 11.7% |
| South Africans | 89.3 /100 | #109 | Excellent 11.7% |
| Immigrants | Jordan | 88.7 /100 | #110 | Excellent 11.7% |
| Burmese | 88.7 /100 | #111 | Excellent 11.7% |
| Immigrants | Bolivia | 88.4 /100 | #112 | Excellent 11.7% |
| Immigrants | Czechoslovakia | 87.0 /100 | #113 | Excellent 11.7% |
| Ukrainians | 86.9 /100 | #114 | Excellent 11.7% |
| New Zealanders | 86.3 /100 | #115 | Excellent 11.7% |