Immigrants from Panama vs Cherokee Child Poverty Among Boys Under 16
COMPARE
Immigrants from Panama
Cherokee
Child Poverty Among Boys Under 16
Child Poverty Among Boys Under 16 Comparison
Immigrants from Panama
Cherokee
17.9%
CHILD POVERTY AMONG BOYS UNDER 16
4.3/ 100
METRIC RATING
221st/ 347
METRIC RANK
19.7%
CHILD POVERTY AMONG BOYS UNDER 16
0.1/ 100
METRIC RATING
270th/ 347
METRIC RANK
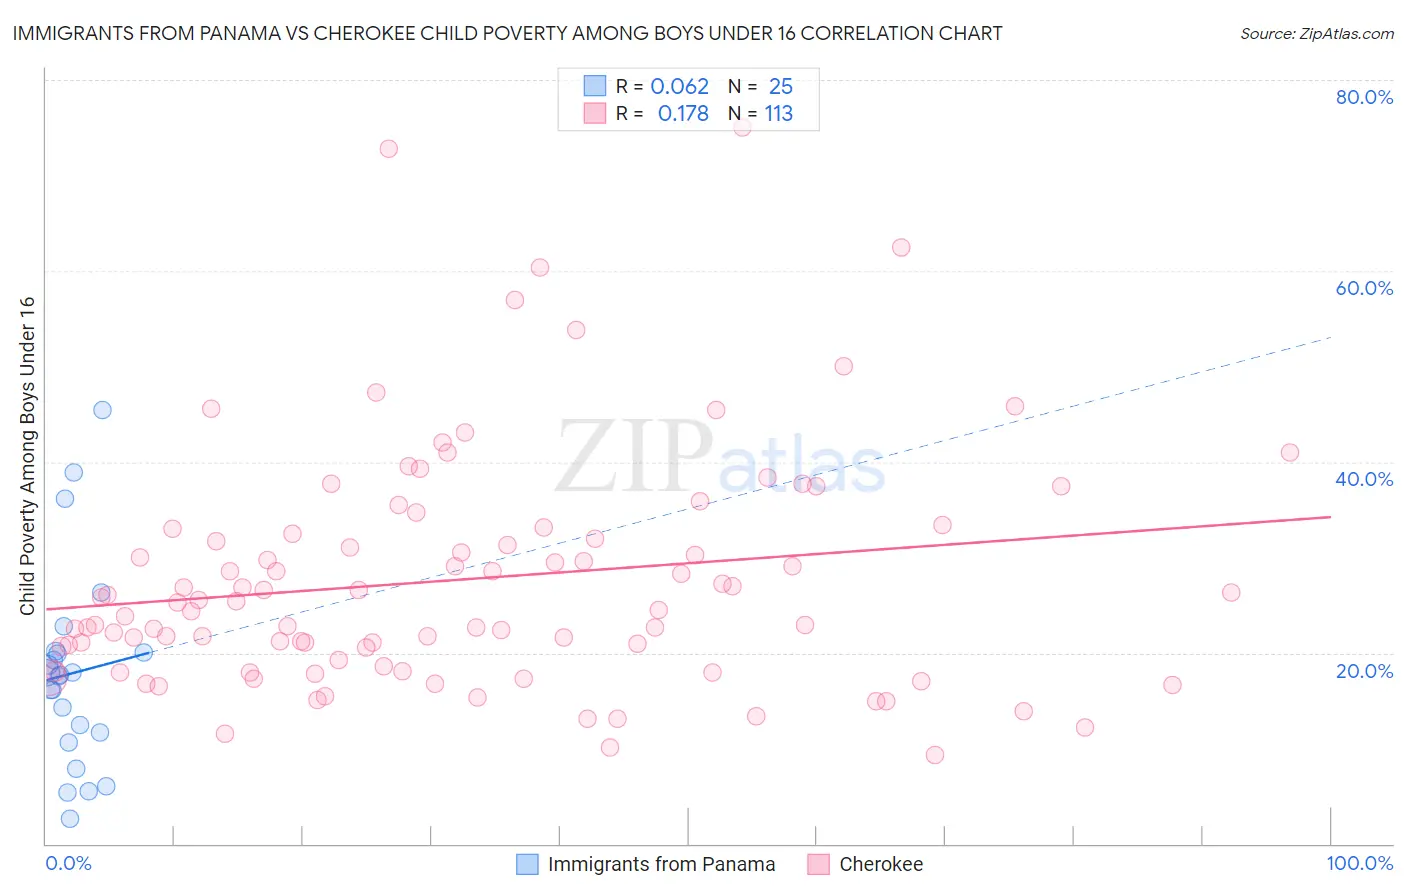
Immigrants from Panama vs Cherokee Child Poverty Among Boys Under 16 Correlation Chart
The statistical analysis conducted on geographies consisting of 219,900,971 people shows a slight positive correlation between the proportion of Immigrants from Panama and poverty level among boys under the age of 16 in the United States with a correlation coefficient (R) of 0.062 and weighted average of 17.9%. Similarly, the statistical analysis conducted on geographies consisting of 484,106,985 people shows a poor positive correlation between the proportion of Cherokee and poverty level among boys under the age of 16 in the United States with a correlation coefficient (R) of 0.178 and weighted average of 19.7%, a difference of 10.3%.
Child Poverty Among Boys Under 16 Correlation Summary
| Measurement | Immigrants from Panama | Cherokee |
| Minimum | 2.7% | 9.3% |
| Maximum | 45.5% | 75.0% |
| Range | 42.8% | 65.7% |
| Mean | 17.9% | 27.7% |
| Median | 17.7% | 25.3% |
| Interquartile 25% (IQ1) | 11.1% | 19.0% |
| Interquartile 75% (IQ3) | 20.1% | 32.7% |
| Interquartile Range (IQR) | 8.9% | 13.8% |
| Standard Deviation (Sample) | 10.3% | 12.4% |
| Standard Deviation (Population) | 10.1% | 12.3% |
Similar Demographics by Child Poverty Among Boys Under 16
Demographics Similar to Immigrants from Panama by Child Poverty Among Boys Under 16
In terms of child poverty among boys under 16, the demographic groups most similar to Immigrants from Panama are Pennsylvania German (17.9%, a difference of 0.23%), Cuban (17.9%, a difference of 0.32%), Immigrants from Cambodia (17.8%, a difference of 0.47%), Sierra Leonean (17.8%, a difference of 0.60%), and Iraqi (17.7%, a difference of 0.68%).
| Demographics | Rating | Rank | Child Poverty Among Boys Under 16 |
| Panamanians | 5.9 /100 | #214 | Tragic 17.7% |
| Osage | 5.8 /100 | #215 | Tragic 17.7% |
| Moroccans | 5.6 /100 | #216 | Tragic 17.7% |
| Japanese | 5.5 /100 | #217 | Tragic 17.7% |
| Iraqis | 5.5 /100 | #218 | Tragic 17.7% |
| Sierra Leoneans | 5.3 /100 | #219 | Tragic 17.8% |
| Immigrants | Cambodia | 5.1 /100 | #220 | Tragic 17.8% |
| Immigrants | Panama | 4.3 /100 | #221 | Tragic 17.9% |
| Pennsylvania Germans | 3.9 /100 | #222 | Tragic 17.9% |
| Cubans | 3.8 /100 | #223 | Tragic 17.9% |
| Nepalese | 3.2 /100 | #224 | Tragic 18.0% |
| Inupiat | 2.7 /100 | #225 | Tragic 18.1% |
| Immigrants | Africa | 2.6 /100 | #226 | Tragic 18.1% |
| Bermudans | 2.5 /100 | #227 | Tragic 18.1% |
| Immigrants | Nonimmigrants | 2.2 /100 | #228 | Tragic 18.2% |
Demographics Similar to Cherokee by Child Poverty Among Boys Under 16
In terms of child poverty among boys under 16, the demographic groups most similar to Cherokee are Immigrants from Cabo Verde (19.7%, a difference of 0.28%), Spanish American Indian (19.6%, a difference of 0.44%), Chickasaw (19.8%, a difference of 0.50%), Vietnamese (19.6%, a difference of 0.55%), and Immigrants from El Salvador (19.6%, a difference of 0.57%).
| Demographics | Rating | Rank | Child Poverty Among Boys Under 16 |
| Ottawa | 0.1 /100 | #263 | Tragic 19.5% |
| Iroquois | 0.1 /100 | #264 | Tragic 19.6% |
| Guyanese | 0.1 /100 | #265 | Tragic 19.6% |
| Immigrants | El Salvador | 0.1 /100 | #266 | Tragic 19.6% |
| Vietnamese | 0.1 /100 | #267 | Tragic 19.6% |
| Spanish American Indians | 0.1 /100 | #268 | Tragic 19.6% |
| Immigrants | Cabo Verde | 0.1 /100 | #269 | Tragic 19.7% |
| Cherokee | 0.1 /100 | #270 | Tragic 19.7% |
| Chickasaw | 0.1 /100 | #271 | Tragic 19.8% |
| Immigrants | Ecuador | 0.1 /100 | #272 | Tragic 19.8% |
| Belizeans | 0.1 /100 | #273 | Tragic 19.9% |
| Immigrants | Bangladesh | 0.0 /100 | #274 | Tragic 19.9% |
| Jamaicans | 0.0 /100 | #275 | Tragic 20.0% |
| Sub-Saharan Africans | 0.0 /100 | #276 | Tragic 20.0% |
| Immigrants | Barbados | 0.0 /100 | #277 | Tragic 20.0% |